🚀 Bitcoin Targets $120K as Ethereum & Ripple Ride the Bull Wave – Top 3 Crypto Price Predictions for July 2025

Crypto markets are charging ahead—Bitcoin’s leading the pack with a $120K price target while Ethereum and Ripple fuel the rally. Here’s the breakdown.
Bitcoin (BTC): The Bull Flag Rises Higher
BTC isn’t just flirting with new highs—it’s bulldozing toward $120K, leaving skeptics scrambling. Institutional inflows and ETF demand are turning ‘overbought’ into ‘just getting started.’
Ethereum (ETH): Smart Money Doubles Down
ETH’s rally isn’t just riding Bitcoin’s coattails. DeFi activity and layer-2 adoption are pushing gas fees—and prices—higher. Traders eyeing $6K? Not if the whales get there first.
Ripple (XRP): The Courtroom Halo Effect
XRP’s legal clarity has turned it from a lawsuit magnet to a liquidity darling. Payments narrative? Still shaky. Speculative FOMO? Absolutely printing.
The Close: Greed Is Good (Until It’s Not)
The bulls are in control—for now. Just remember: Wall Street’s ‘blockchain experts’ still think Satoshi is a sushi roll. Trade accordingly.
Bitcoin prints fresh all-time high of $116,868
Bitcoin price consolidation around the upper boundary of a previously broken consolidation zone at $108,355 came to an end on Wednesday. It surged to reach a new all-time high of $116,868 on Thursday. At the time of writing on Friday, it hovers above $116,600.
As BTC enters into a price discovery mode, and if the upward trend continues, it could extend the rally toward its key psychological level of $120,000.
The Relative Strength Index (RSI) on the daily chart reads 71, above its overbought level of 70, indicating strong bullish momentum. However, traders should be cautious as the chances of a pullback are high due to its overbought condition. Meanwhile, the Moving Average Convergence Divergence (MACD) indicator displayed a bullish crossover at the end of June. It also shows rising green histogram bars above its neutral zero line, suggesting bullish momentum is gaining traction and continuing an upward trend.
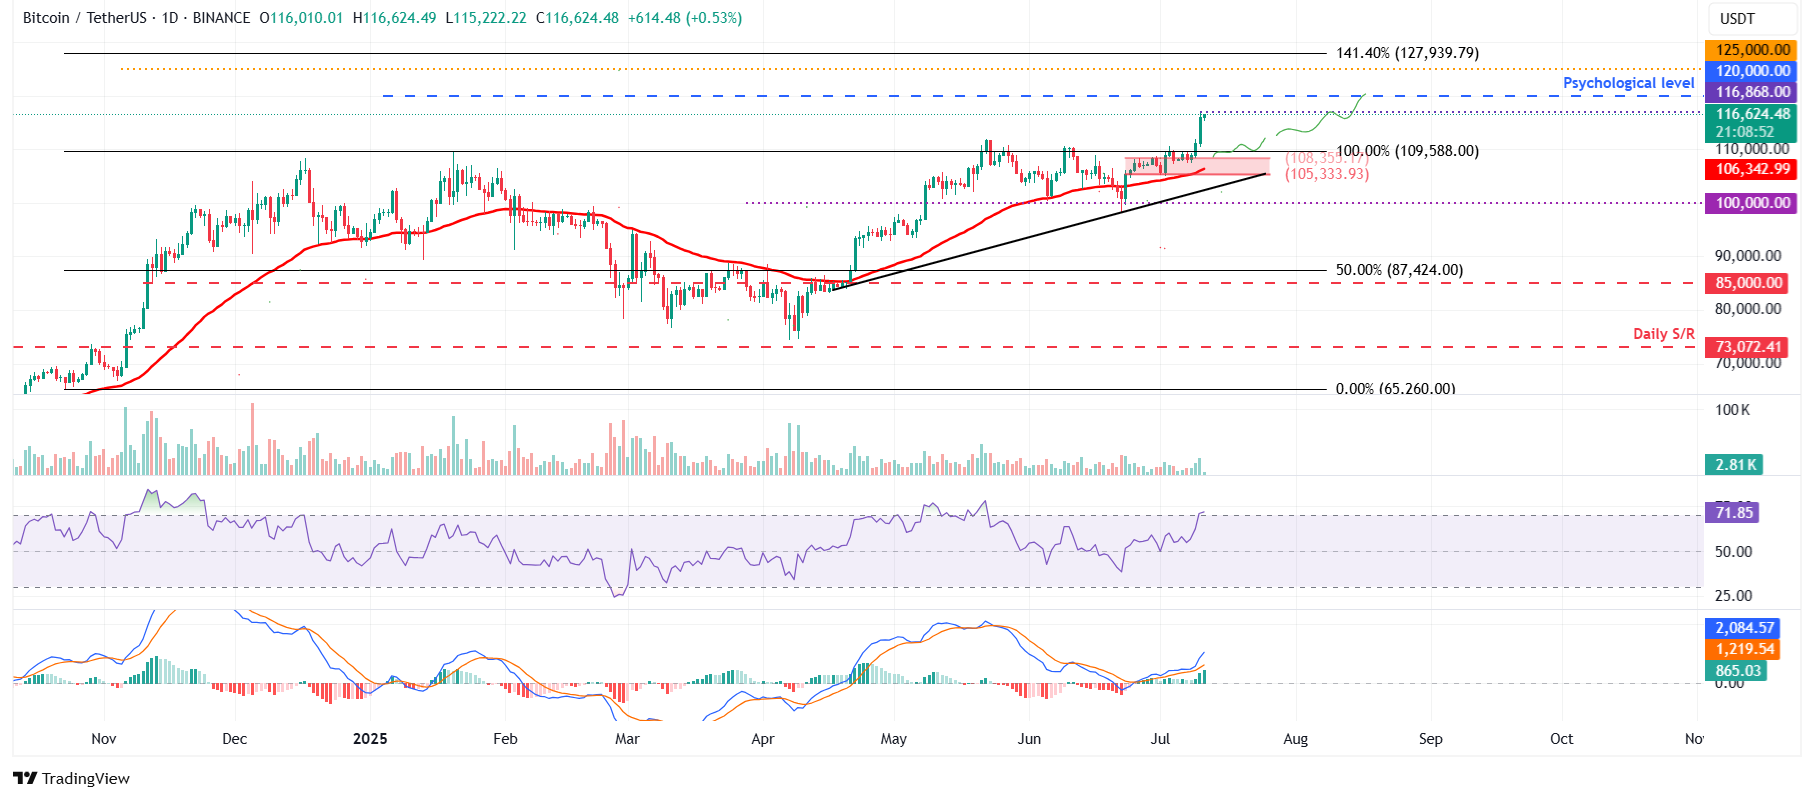
BTC/USDT daily chart
However, if BTC faces a correction, it could extend the decline to find support around the upper boundary of a previously broken consolidation zone at $108,355.
Ethereum could extend further gains if it closes above $3,000 resistance
Ethereum price rebounded after finding support around its daily level of $2,461 last week and rallied 10%, closing above its daily resistance at $2,724 on Wednesday. It continued its rally by 6.59% the next day and retested its key psychological level at $3,000. At the time of writing on Friday, it hovers at around $2,970.
If ETH closes above $3,000 on a daily basis, it could extend the rally toward its next daily resistance level at $3,730.
The RSI on the daily chart reads 72, above its overbought level of 70, indicating strong bullish momentum. Meanwhile, the MACD indicator displayed a bullish crossover last week. It also shows rising green histogram bars above its neutral zero line, suggesting bullish momentum is gaining traction and continuing an upward trend.
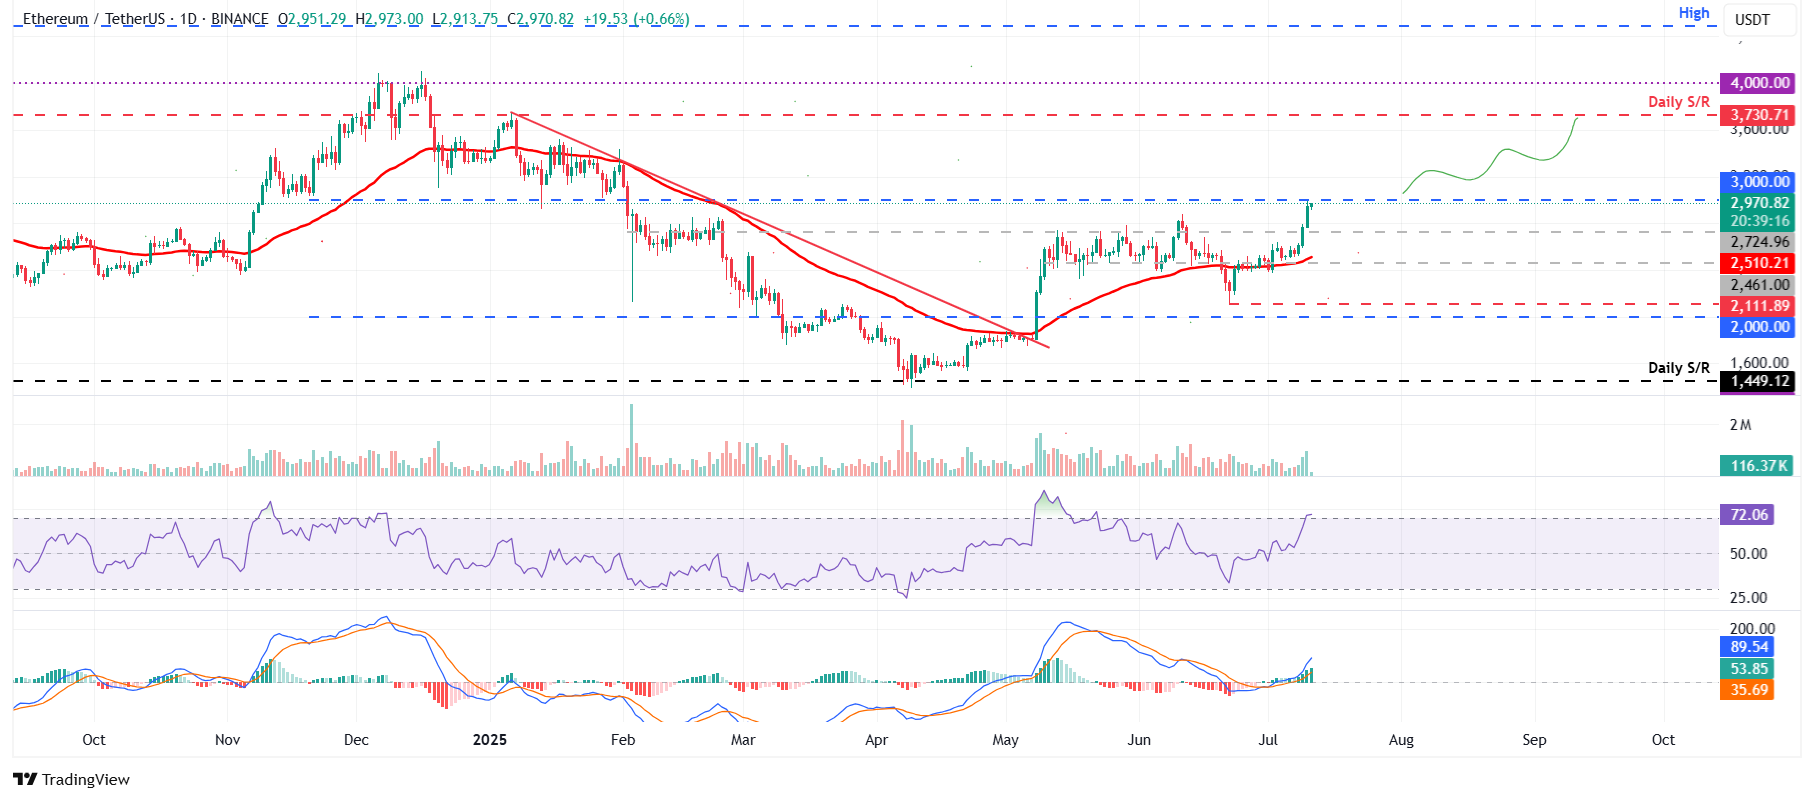
ETH/USDT daily chart
However, if ETH faces rejection from $3,000, it could extend the decline to find support around its daily level of $2,724.
XRP bulls are in control of the momentum
XRP price broke above the descending trendline (drawn by connecting multiple highs since mid-May) on June 30 and found support around its previous level over the next two days, rallying 4.5% until Sunday. As of this week, it continued to surge by nearly 13%, closing above its May 23 high of $2.47 on Thursday. At the time of writing on Friday, it hovers at around $2.57.
If XRP continues its upward momentum, it could extend the rally toward its daily resistance at $2.72, with eyes on $3.00 next.
The RSI on the daily chart reads 73, above its overbought level of 70, indicating strong bullish momentum. The MACD indicator on the daily chart displayed a bullish crossover last week and shows rising green histogram bars above its neutral level, suggesting bullish momentum and indicating an upward trend.
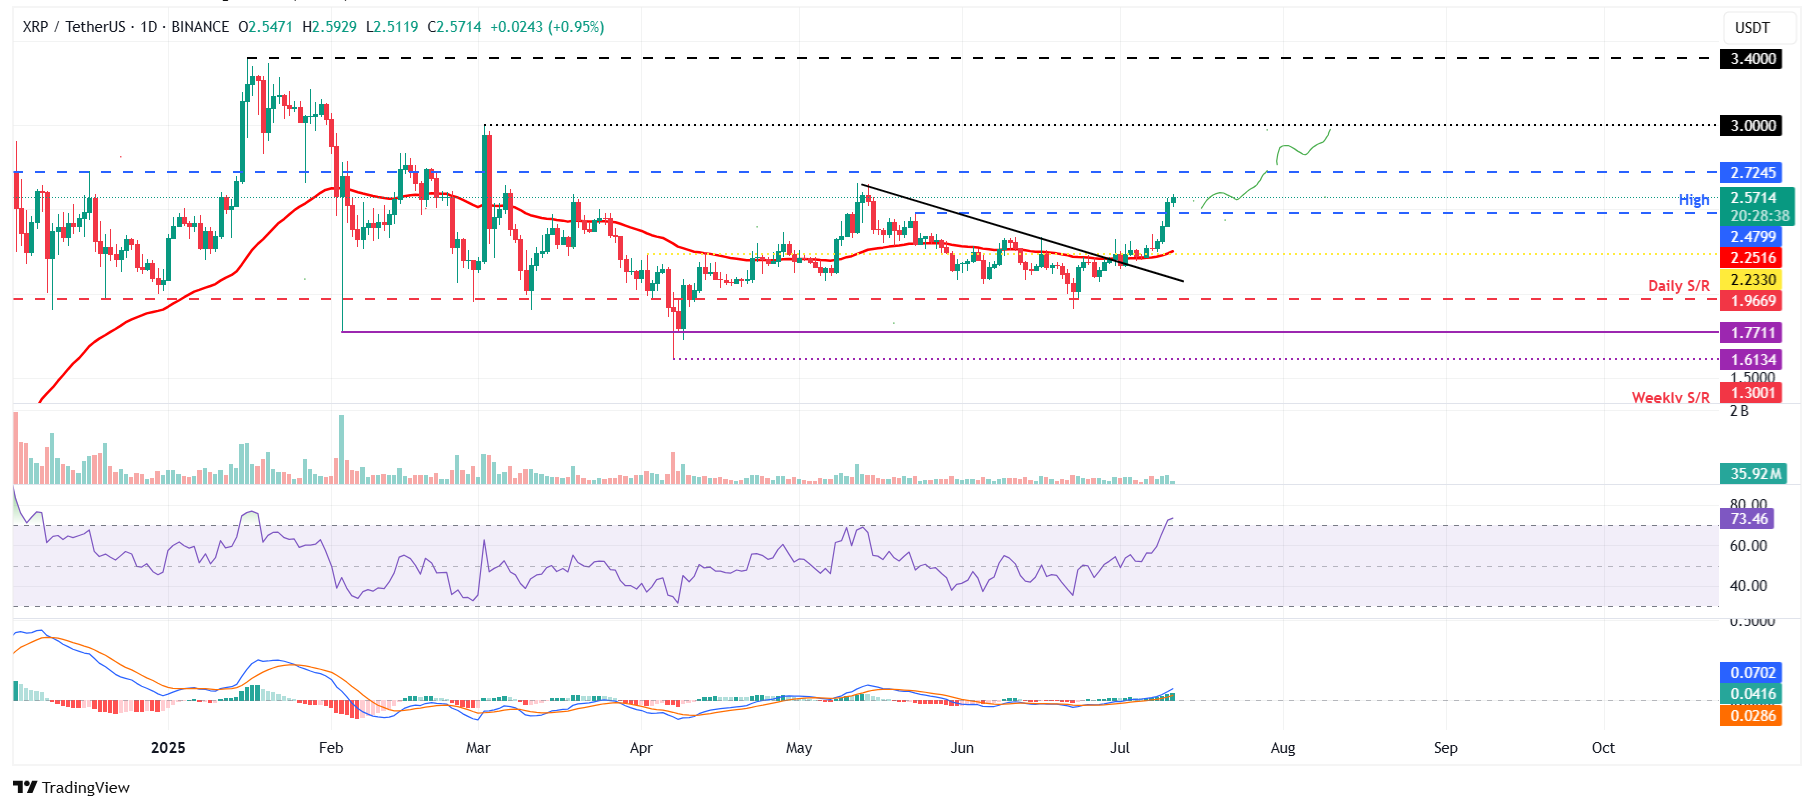
XRP/USDT daily chart
However, if XRP faces a correction, it could extend the decline to find support at $2.47.
