Stellar (XLM) Bulls Charge Ahead as TVL & Stablecoin Demand Surge – Time to Buy?

Stellar's XLM is riding a bullish wave as key metrics flash green. The network's Total Value Locked (TVL) and stablecoin activity are spiking—signaling growing institutional confidence in the cross-border payment disruptor.
Why Traders Are Betting on XLM
Unlike legacy finance's plodding SWIFT system, Stellar's rails move value at crypto speed. The recent TVL surge suggests big players are parking capital for the long haul, while stablecoin volume hints at real-world adoption.
The Cynic's Corner
Wall Street still thinks 'blockchain, not Bitcoin'—but they'll come crawling to XLM when they realize their private ledgers can't match Stellar's 5,000 TPS. Another 'Aha!' moment for finance's slow learners.
Stellar’s TVL reaches all-time highs of over $97 million
Data from crypto intelligence tracker DefiLlama shows that Stellar’s TVL increase reached a new all-time high (ATH) of $97.7 million on Wednesday. This increase in TVL indicates growing activity and interest within Stellar’s ecosystem, suggesting that more users are depositing or utilizing assets within XLM-based protocols.
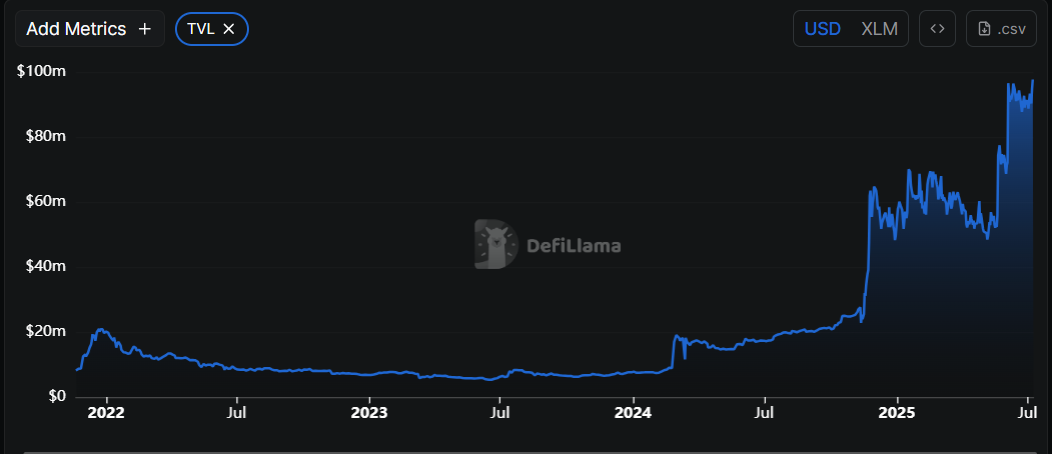
Stellar TVL chart. Source: DefiLlama
Artemis terminal data show that XLM’s stablecoin market capitalization has risen sharply since mid-June and currently stands at $630.9 million as of Wednesday. Such stablecoin activity and value increase on the XLM project indicate a bullish outlook, as they boost network usage and can attract more users to the ecosystem.
-1752039803899.jpeg)
XLM stablecoins Mcap chart. Source: Artemis terminal
Stellar Price Prediction: XLM bulls are in control of the momentum
Stellar price broke above the descending trendline (drawn by connecting multiple highs since the end of November) on Sunday. It rallied nearly 9%, closing above its 50-day Exponential Moving Average (EMA) at $0.255 until Tuesday. At the time of writing on Wednesday, it continues to trade higher at around $0.265.
If XLM continues its upward momentum, it could extend the rally to retest its June 11 high of $0.258. A successful close above this level could extend the gains toward the next resistance, which is the daily resistance level of $0.356.
The Relative Strength Index (RSI) on the daily chart reads 59, above its neutral level of 50 and points upwards, indicating strong bullish momentum. The Moving Average Convergence Divergence (MACD) indicator on the daily chart also displayed a bullish crossover on July 3. It also shows rising green histogram bars above its neutral level, suggesting bullish momentum and indicating an upward trend.
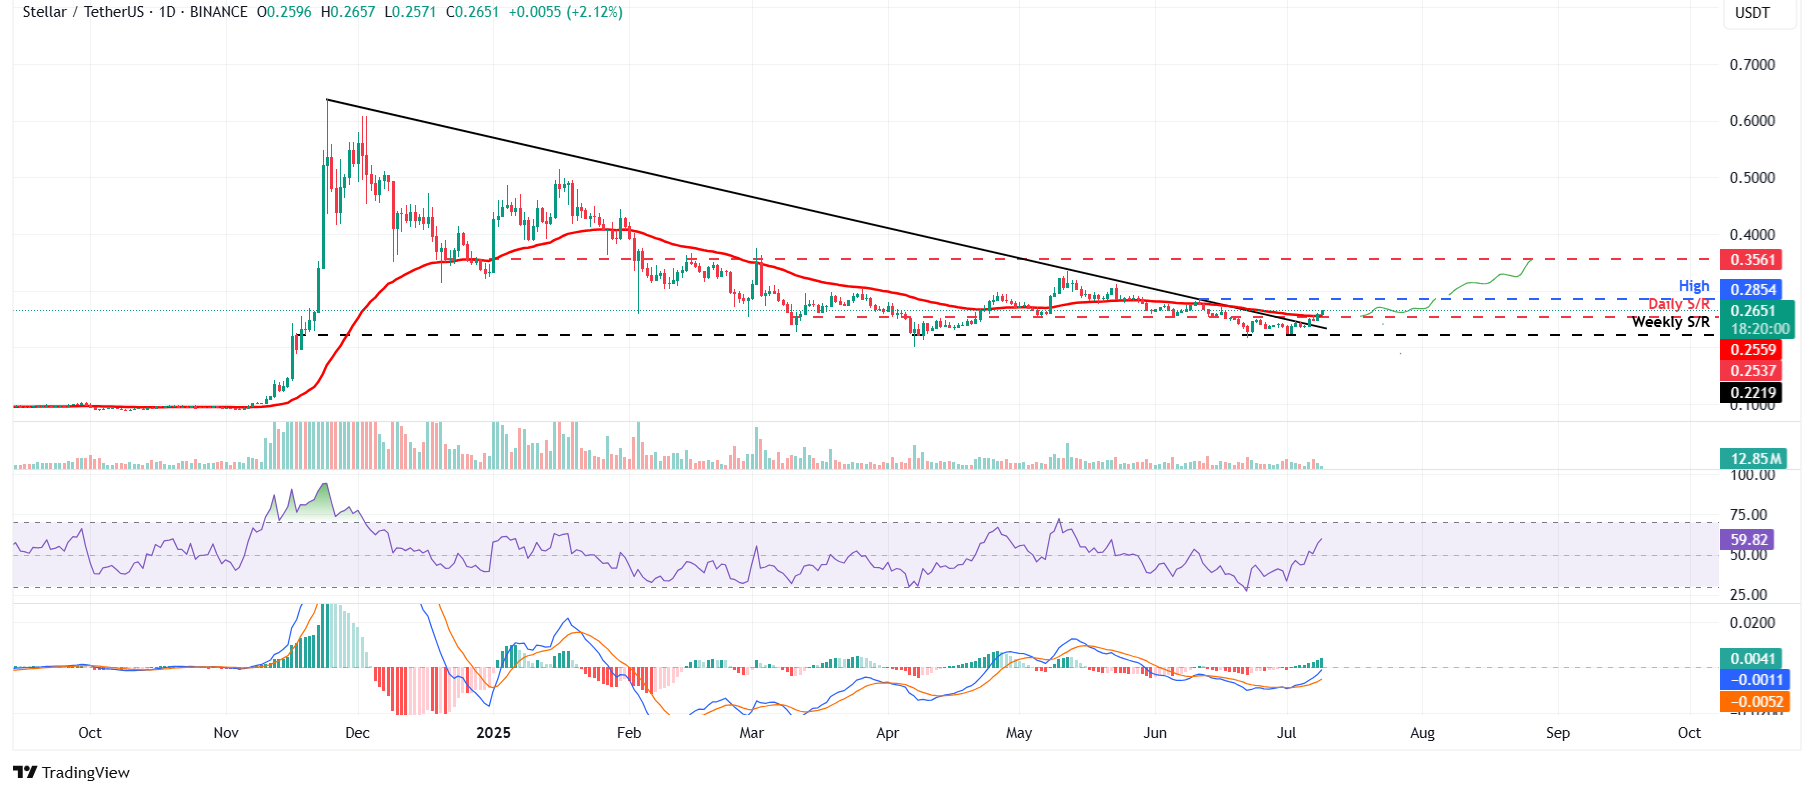
XLM/USDT daily chart
However, if XLM faces a correction, it could extend the decline to retest its weekly support at 0.221.

Log in to Reply
Log in to comment your thoughtsComments
Related Articles
|Square
Get the BTCC app to start your crypto journey
Get started today Scan to join our 100M+ users