Dogwifhat (WIF) Price Prediction: Bullish Momentum Accelerates as Trading Volume Explodes Past $236M

Memecoin madness reloaded: Dogwifhat (WIF) stages a comeback as traders pile into the Solana-based token.
Volume tells the story—$236M floods in as WIF shakes off the bearish dust. Is this the start of another parabolic move or just degens chasing the next dopamine hit?
Technical breakout or hype cycle? The chart paints a bullish picture, but let's see how long the 'fundamentals' of dog-themed tokens hold up this time.
Wall Street analysts weep into their spreadsheets as a hat-wearing Shiba once again outperforms their precious 'value stocks.'

Following a sharp rally earlier this month, the token has entered a corrective phase but remains positioned above recent lows.
Despite modest price shifts, the underlying metrics suggest increasing market engagement, as total volume exceeded $236 million over the past 24 hours. This rise in trading activity could provide the groundwork for a larger directional MOVE if momentum aligns with technical confirmation.
Dogwifhat (WIF) Price Short-Term Pullback Meets Support Near $0.84
The WIF/USD 1-hour chart on Open Interest outlines a pronounced parabolic move between July 2 and July 3, when the token surged from under $0.78 to slightly above $0.95. The sharp rally exhibited strong bullish pressure, with minimal retracement, suggesting heavy accumulation during the breakout. However, this steep ascent was followed by a notable retracement, as traders began to unwind positions, and the price reverted to a range between $0.82 and $0.84.
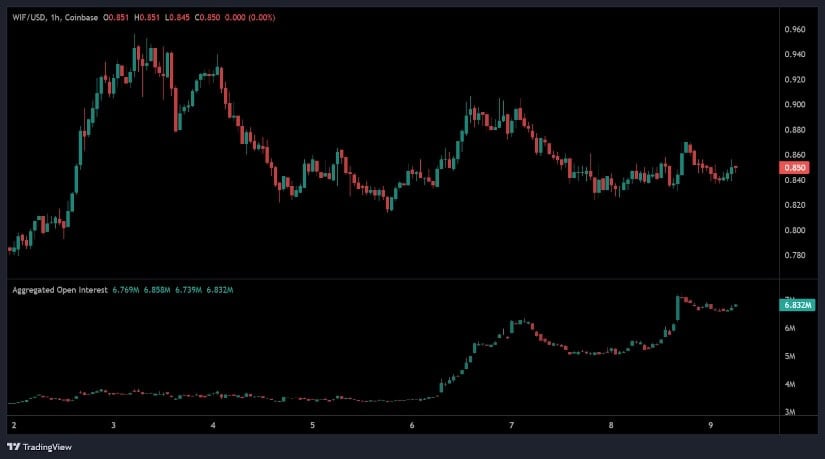
Source: Chart by Open Interest
Over the following days, the chart reflected a declining structure, with lower highs and lower lows forming into July 7. Despite the downtrend, support at $0.84 held firm, resulting in a consolidation pattern supported by reduced volatility and smaller candlestick bodies.
During this period, aggregated open interest rose from around 3 million to over 6.83 million by July 9. This increase in open interest signals heightened participation, possibly from traders preparing for another breakout. Price movement above the $0.87–$0.89 resistance range WOULD be required to initiate another push toward the previous $0.95 high, while a breakdown below $0.84 could confirm a deeper correction.
Daily Volume Surge Reflects Renewed Market Activity
Between July 8 and July 9, WIF recorded volatile intraday action, opening NEAR $0.84 and reaching a local high of approximately $0.856. Despite multiple bullish impulses during the early session, the price failed to sustain the upward momentum and fell back toward support levels. The formation of lower highs and eventual price stabilization near $0.84 signaled a temporary consolidative phase rather than a reversal.
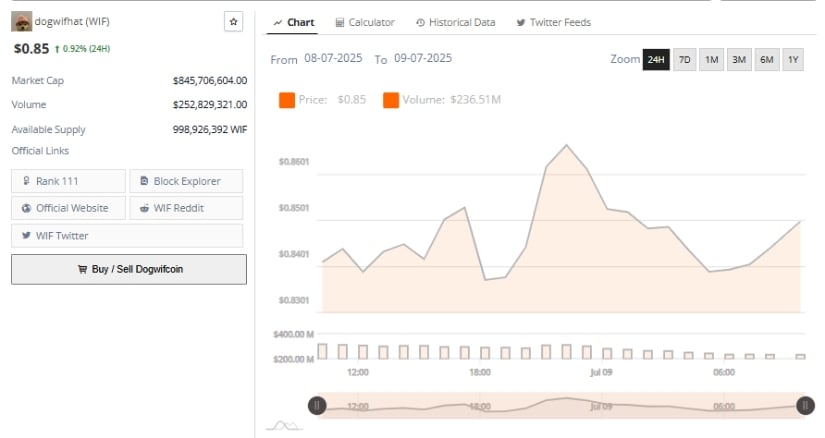
Source: Chart by BraveNewCoin
Trading volume for the 24 hours totaled $236.51 million, underlining increased market participation. This level of volume, combined with the token’s recovery toward the $0.85 region by the session close, indicates that buyers were active during dips, possibly defending the $0.84 base.
A sustained push above $0.86 could set the stage for a short-term rally, provided volume continues to support the move. The steady volume bars also suggest that participants are awaiting a trigger event or a technical breakout to confirm the next directional leg.
WIF currently holds a mid-tier market capitalization, with price movement influenced by sentiment shifts and liquidity conditions. If accumulation persists above $0.84 and the resistance band at $0.87 is tested with rising volume, WIF could attempt a recovery toward its early July highs. However, failure to clear the consolidation range may expose the token to renewed pressure from profit-taking or macro-level risk-off events.
Indicators Point to Balanced Momentum and Weak Breakout Signals
As of July 9, the daily WIF/USDT chart from TradingView shows price action hovering at $0.852, with the token trading within a narrow range for several sessions. The Relative Strength Index (RSI) is currently at 50.34, aligned with the RSI-based moving average of 50.12, indicating a neutral market stance.
These levels reflect consolidation, with neither bullish nor bearish extremes in control. Movement above 60 could indicate a trend shift, while a drop below 45 might validate downside continuation.
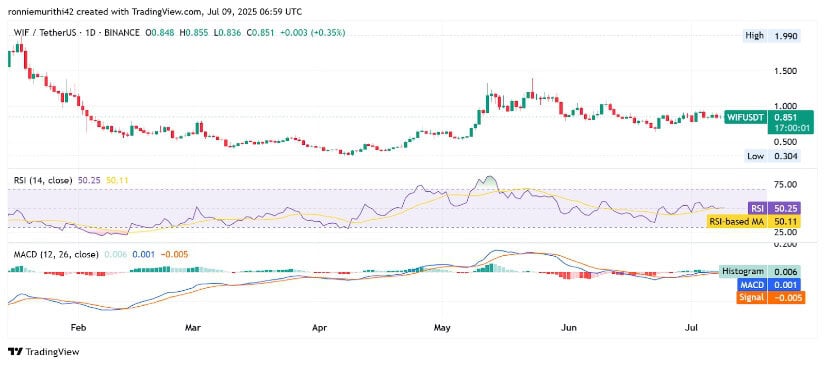
Source: Chart by TradingView
MACD readings suggest an early-stage bullish crossover. The MACD line (0.001) has crossed just above the signal line (-0.005), with the histogram posting a small positive reading of 0.006. While these values are near neutral, the crossover may signal a possible shift in short-term momentum.
A breakout above $0.87 with accompanying MACD histogram expansion would provide firmer confirmation of a bullish trend reversal. Until then, WIF remains in a technical equilibrium, with volume and breakout direction likely to dictate its near-term trajectory.
