Cardano (ADA) Price Alert: Negative MVRV Ratio and Surging Liquidations Signal More Pain Ahead

Cardano's ADA is teetering on the edge—again. With its Market Value to Realized Value (MVRV) ratio plunging into negative territory and long positions getting obliterated, the 'Ethereum killer' looks more like a cautionary tale.
Blood in the water? The MVRV flip spells trouble.
When the MVRV ratio dips below zero, it means the average holder is underwater. For ADA, that’s a red flag waving in a bear market storm. Combine that with a spike in liquidations, and you’ve got a recipe for panic selling—or at least a few sleepless nights for bagholders.
Liquidation surge: No mercy for overleveraged bulls.
The numbers don’t lie: ADA longs are getting wrecked. Whether it’s overconfidence or just bad timing, traders betting on a quick rebound are getting steamrolled. Classic crypto—where ‘hodl’ sometimes just means ‘hold my beer while I lose money.’
Bottom line: ADA’s path of least resistance is down—until it isn’t. But with negative momentum and leveraged traders getting flushed, don’t expect a hero’s comeback anytime soon. (And remember: in crypto, ‘fundamentals’ are just something you ignore until they bite you.)
On-chain data point to Cardano as undervalued
Santiment’s data displays the weekly Market Value to Realized Value (MVRV) ratio turning negative to -12.27%. Typically, the ratio helps analyse the average profit or loss of investors. A negative ratio implies that if all ADA tokens were sold, an average investor WOULD be at a loss of roughly 12%.
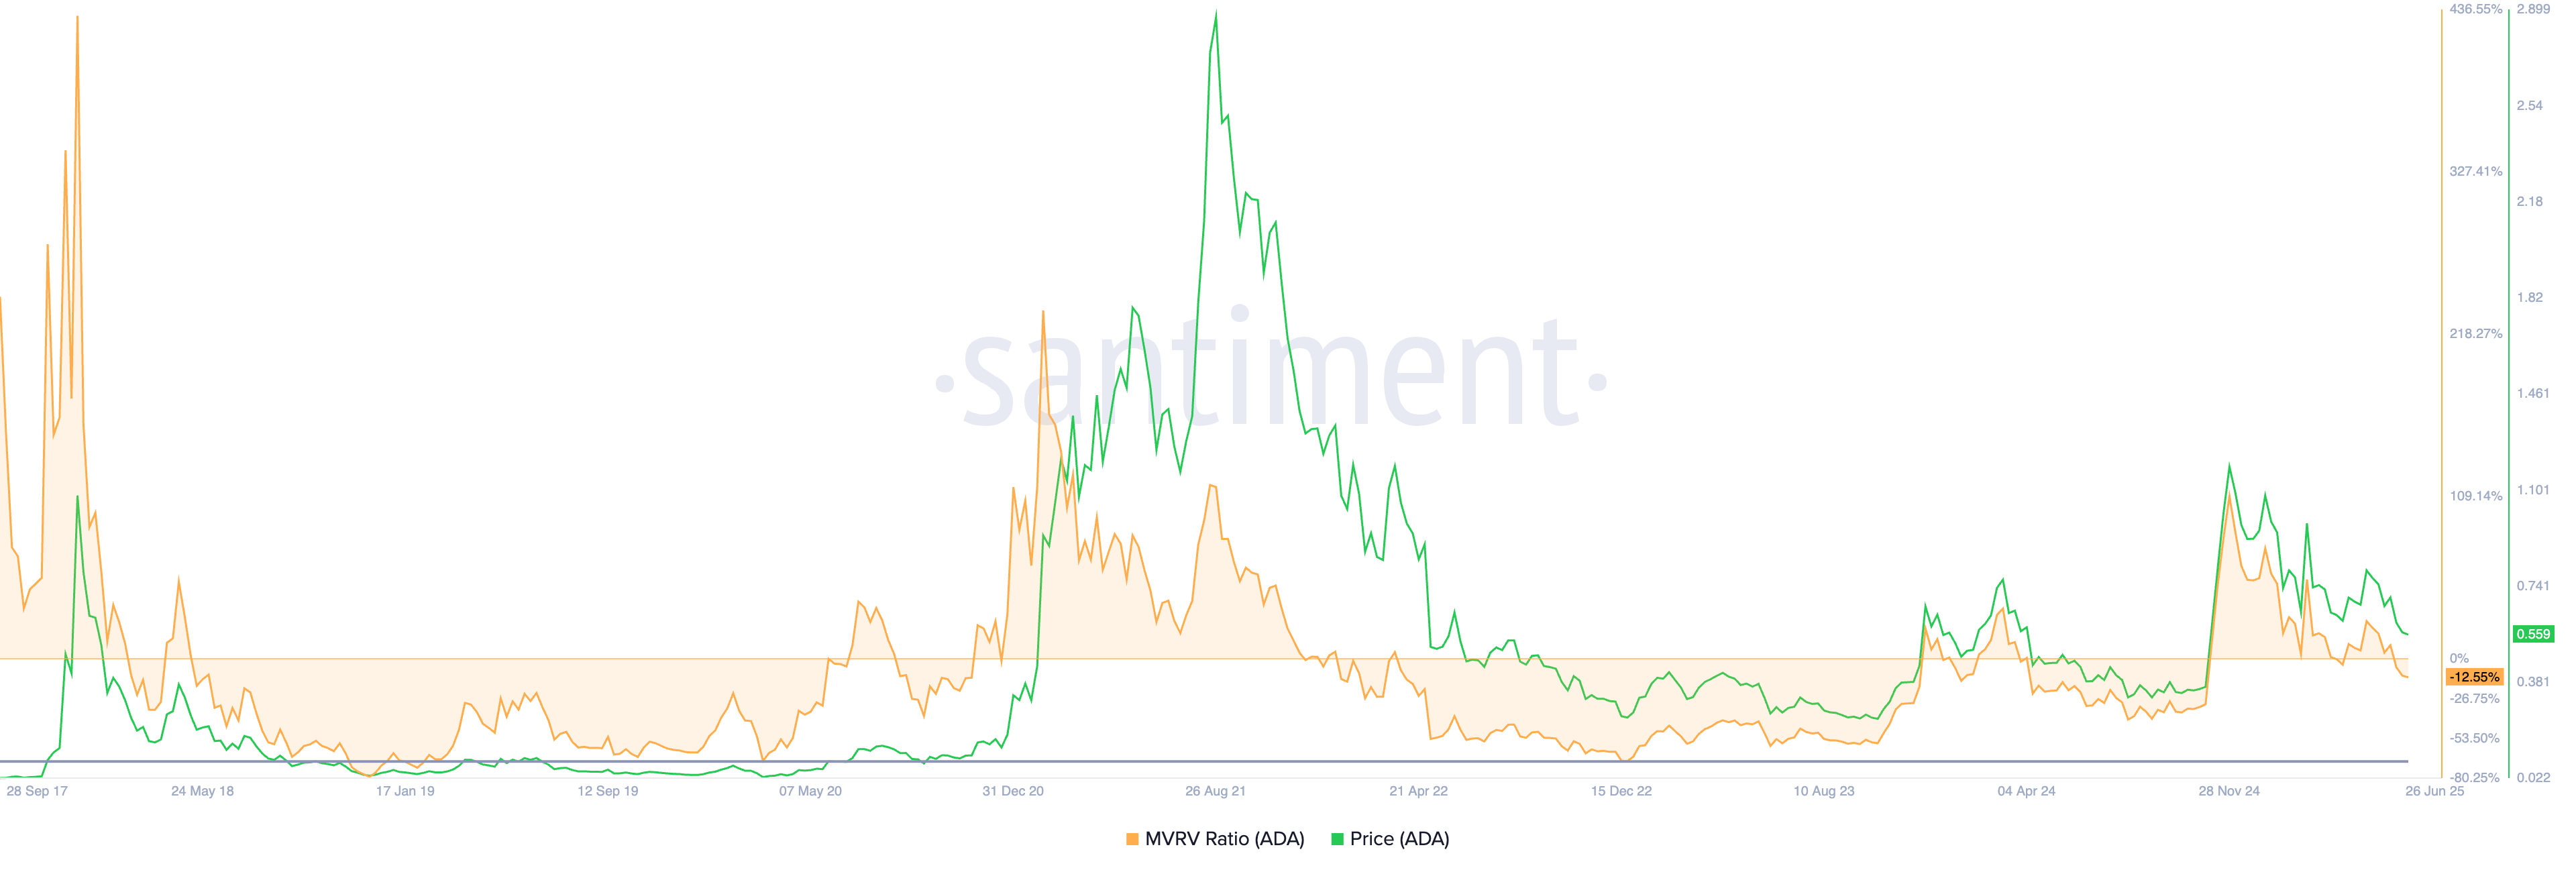
Cardano MVRV. Source: Santiment
It is worth noting that as the market value falls below the realized value, cardano becomes undervalued, as seen before in 2024 and the period of 2022-23.
Bullish ADA positions worth over $1 million wiped out
CoinGlass’ data shows the ADA Open Interest (OI) at $712.27 million, marking a 2.15% decrease in the last 24 hours. The plunge in OI relates to a halt in capital inflow due to the closing of positions.
Amid declining trading activity, the OI-weighted funding rate has dropped to 0.0029%, from a peak of 0.0075% on Thursday. The funding rates are imposed to balance swap and spot prices, and when the positive rate declines, it indicates a cooled-down buying activity.
The 24-hour liquidations reflect a massive wipeout of bullish-aligned traders. To put this in perspective, the $1 million in long liquidations far exceeds the $180K in short liquidations. Notably, the long/short ratio dips to 0.9429, indicating a significant increase in short positions.
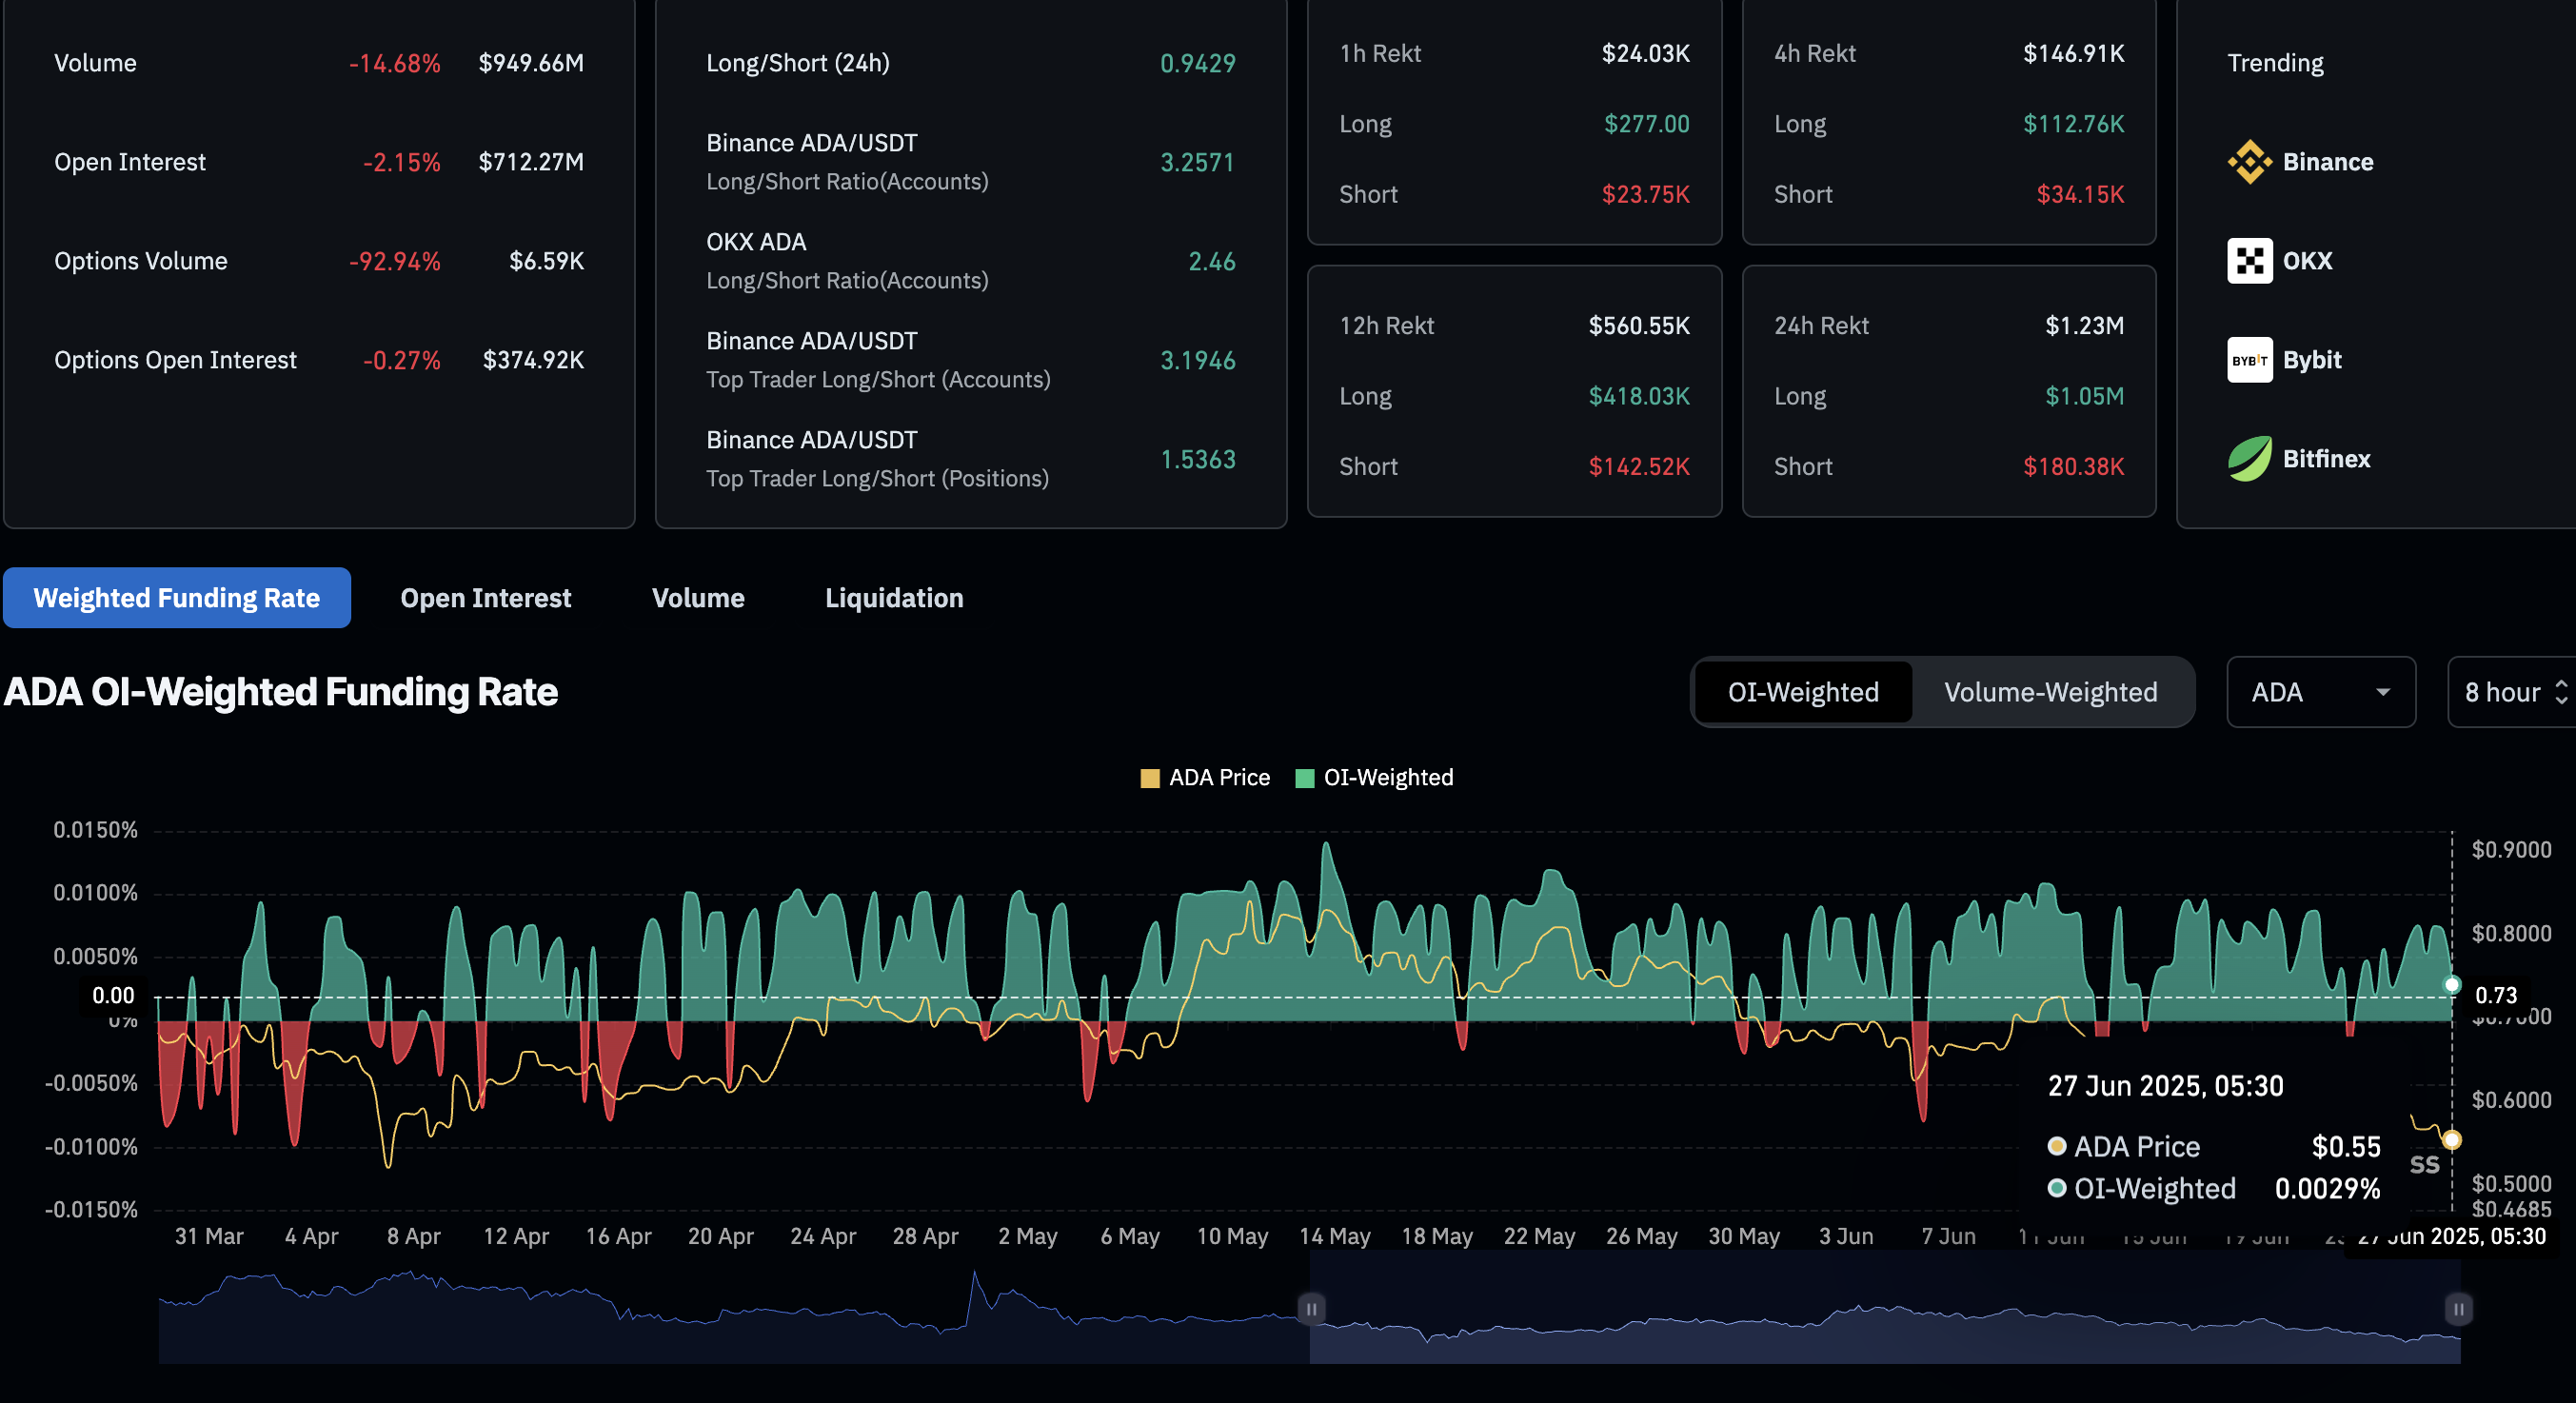
Cardano derivatives data. Source: Coinglass
Cardano struggles to surpass a dynamic resistance within a falling channel
Cardano fails to surpass the 50-period Exponential Moving Average (EMA) on the 4-hour chart, resulting in a pullback to $0.55. With multiple lower shadow candles, ADA edges higher by 1% within four hours, as of press time.
The broader price action forms a falling channel, a bearish trend continuation pattern. A resistance trendline is formed by connecting the swing highs at May 23 and June 11, while the support trendline is connected by bottomed-out downswings on May 19, June 5, and June 19.
A closing below the $0.55 level could extend the correction towards the weekly low of $0.52, followed by the psychological support of $0.50.
The Moving Average Convergence/Divergence (MACD) indicator displays a sell signal as the MACD line crosses below its signal line.
Still, the Relative Strength Index (RSI) at 44 takes an uptick as Cardano edges higher from a newly formed base.
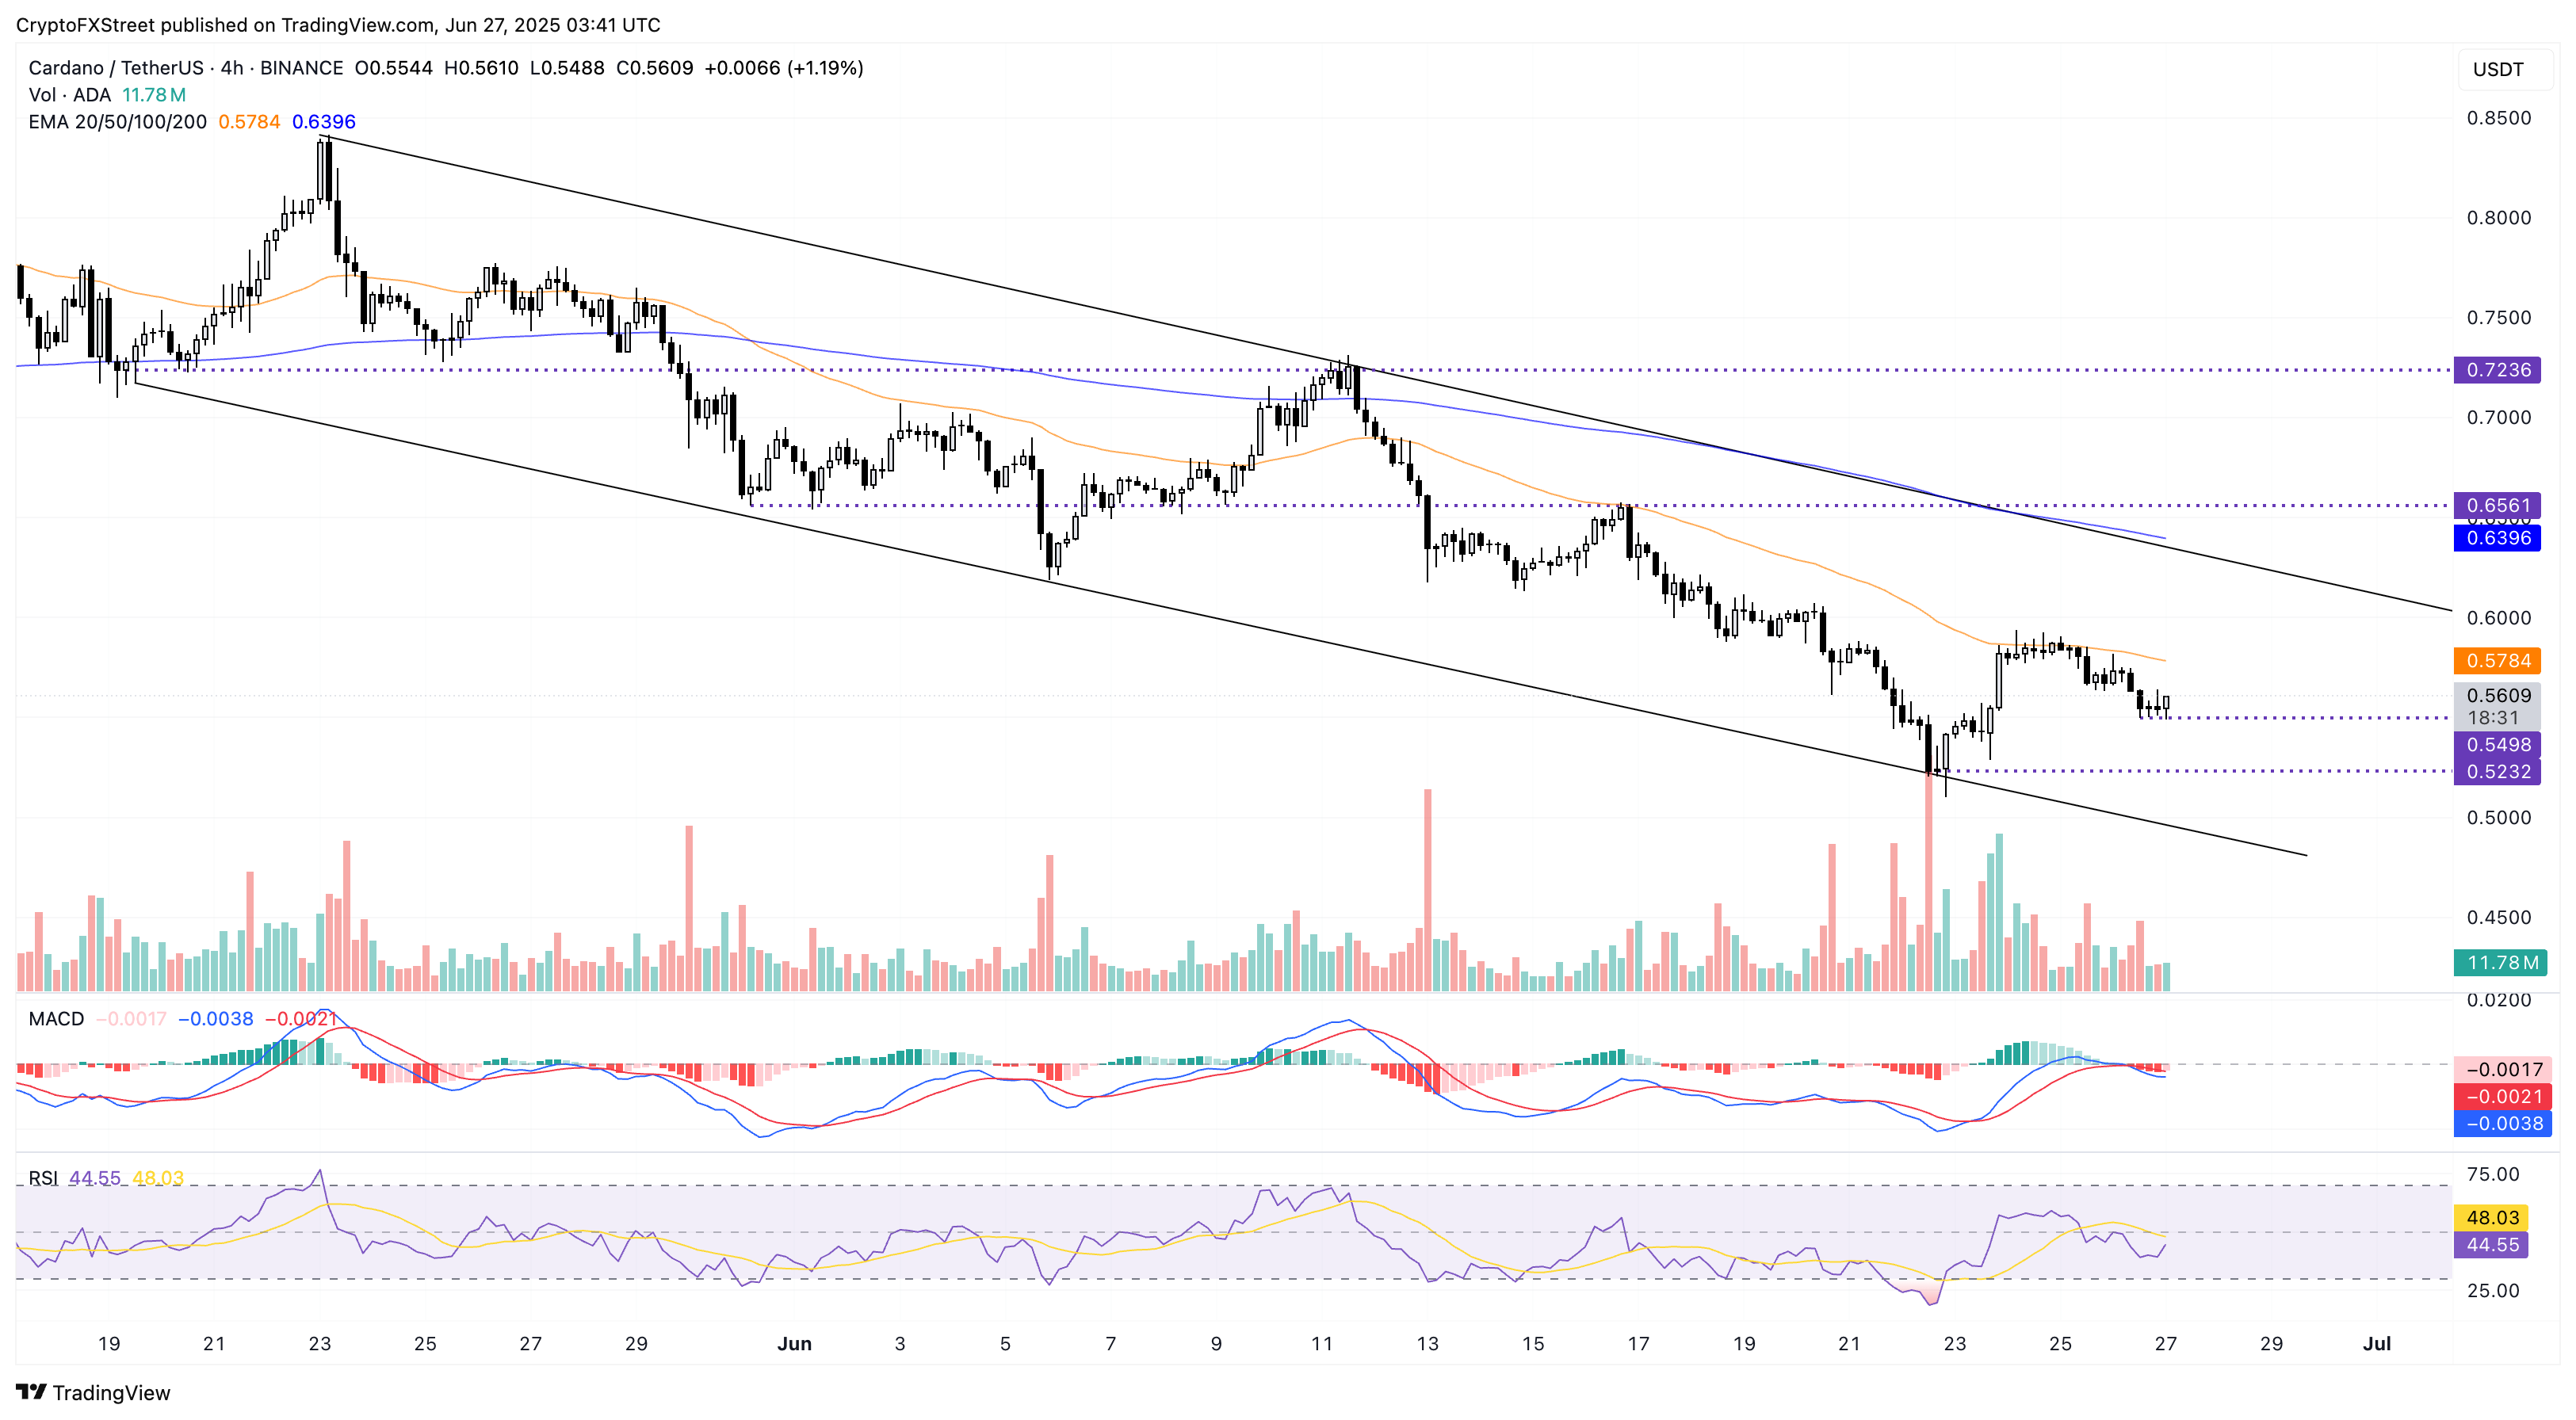
ADA/USDT daily price chart.
A closing above the 50-day EMA could propel Cardano towards the channel’s upper boundary, moving along the 200-day EMA at $0.63.
