🚀 Bitcoin Nears All-Time High While Ethereum & Ripple Tease Explosive Breakouts – Top 3 Crypto Price Predictions

Crypto markets are buzzing as Bitcoin flirts with record territory while ETH and XRP coil for potential parabolic moves. Here's what traders need to watch.
BTC: The ATH Whisperer
Bitcoin's grinding ascent leaves it just shy of its historic peak—market makers are clearly playing chicken with liquidity zones. Another push could trigger a FOMO cascade that'd make 2021 look tame.
ETH: The Sleeping Giant
Ethereum's consolidation pattern screams 'volatility expansion'—technical setups suggest the Merge 2.0 narrative might finally awaken the beast. Institutional money's already placing bets.
XRP: The Phoenix Trade
Ripple's legal purgatory hasn't stopped accumulation patterns from forming. A clean breakout here could embarrass the SEC harder than a Wall Street analyst missing CPI projections.
As always in crypto: the bigger the setup, the harder the rug pull. Trade accordingly—your friendly neighborhood crypto journalist isn't liable for your leverage choices.
Bitcoin inches away from all-time highs
Bitcoin price declined, reaching a daily low of $98,200 on Sunday, but avoided a daily close below the $100,000 psychological level. BTC recovered sharply on Monday and continued its recovery over the next two days, closing above $107,000 on Wednesday and stabilizing the next day. At the time of writing on Friday, it hovers around $107,000.
If BTC continues its ongoing rally, it could extend the rally toward its May 22 all-time high at $111,980. A successful close above this level could extend additional gains to set a new all-time high at $120,000.
The Relative Strength Index (RSI) on the daily chart reads 55, above its neutral level of 50, indicating bullish momentum. The Moving Average Convergence Divergence (MACD) indicator also displayed a bullish crossover on Thursday, providing a buy signal and indicating an upward trend.
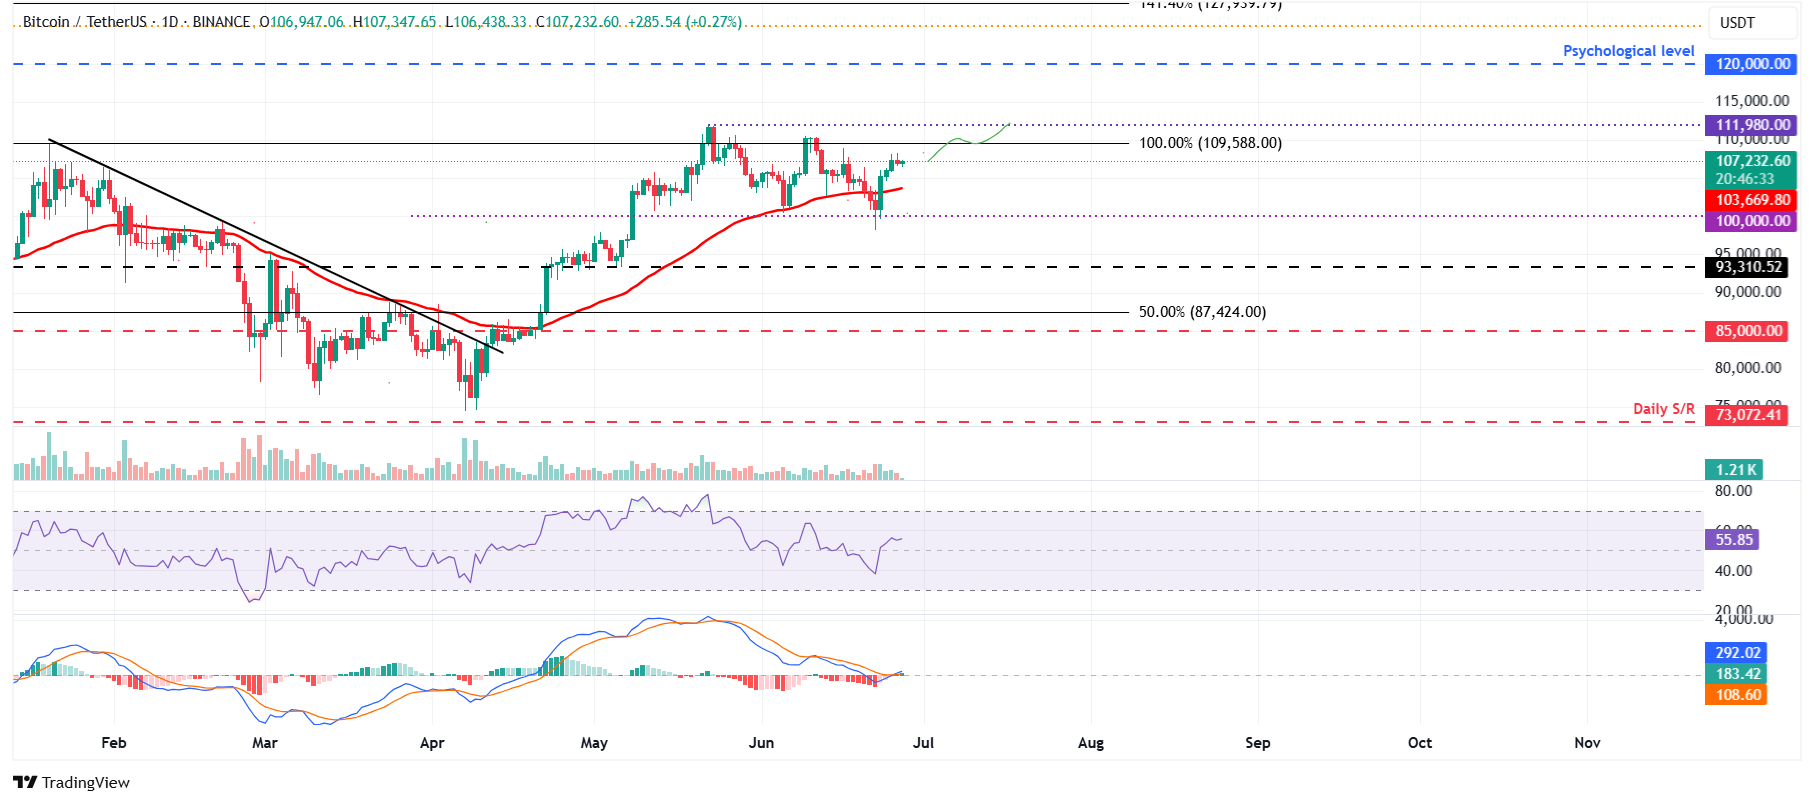
BTC/USDT daily chart
However, if BTC faces a correction, it could extend the decline to find support around its 50-day Exponential Moving Average (EMA) at $103,700.
Ethereum is on the verge of a bullish breakout
Ethereum price has recovered nearly 10% over the last two days, since Monday, and hovered below its key resistance level at $2,461 until Thursday. At the time of writing on Friday, it continues to hover below this key resistance level.
If ETH breaks and closes above the $2,461 daily resistance, it could extend the rally toward its next daily resistance level at $2,724.
The RSI on the daily chart is approaching its neutral level of 50, indicating a fading bearish momentum. For the bullish momentum to be sustained, the RSI must move above its neutral level. The MACD is hinting at a bullish crossover (the MACD line is close to crossing above the signal line), which, if completed, WOULD give a buy signal.
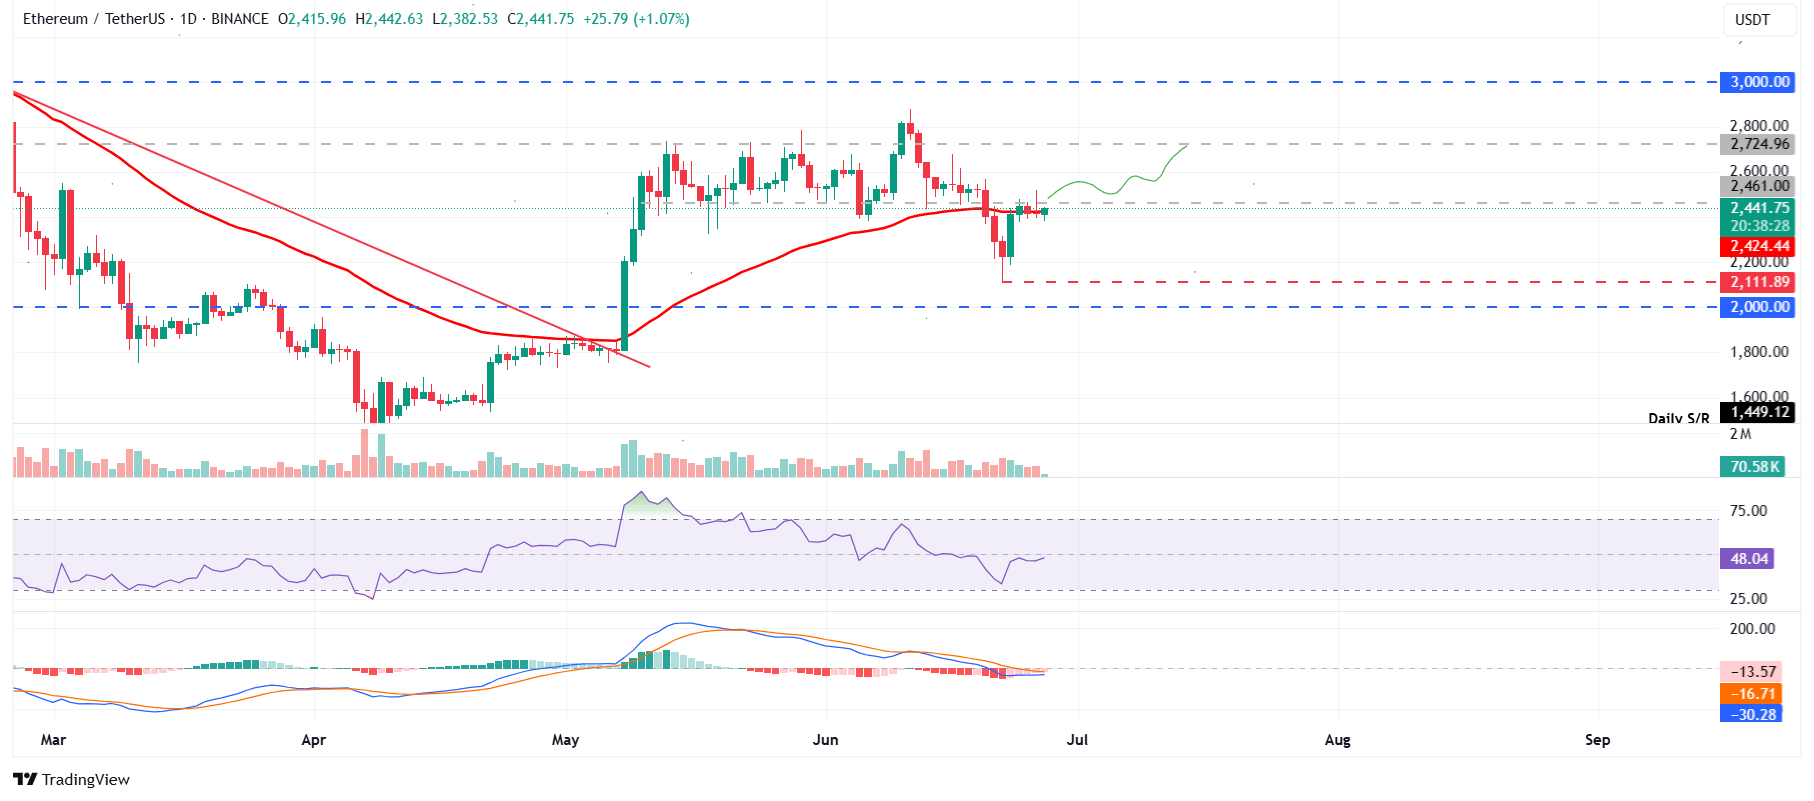
ETH/USDT daily chart
On the other hand, if ETH faces a rejection from the $2,461 level, it could extend the decline to retest its Sunday low of $2,111.
XRP could rally if it closes above its 50-day EMA
Ripple price found support around its daily level at $1.96 on Monday and recovered nearly 9%. However, it faced rejection from its 50-day EMA and declined 3.68% until Thursday. At the time of writing on Friday, it hovers at around $2.10.
If XRP breaks and closes above its 50-day EMA at $2.21 on a daily basis, it could extend the rally toward its May 23 high of $2.47.
The RSI on the daily chart read 44 below its neutral level of 50, indicating bearish momentum.
For the bullish momentum to be sustained, the RSI should continue to MOVE above its neutral level. The MACD indicator also coils against itself, indicating indecisiveness among traders.
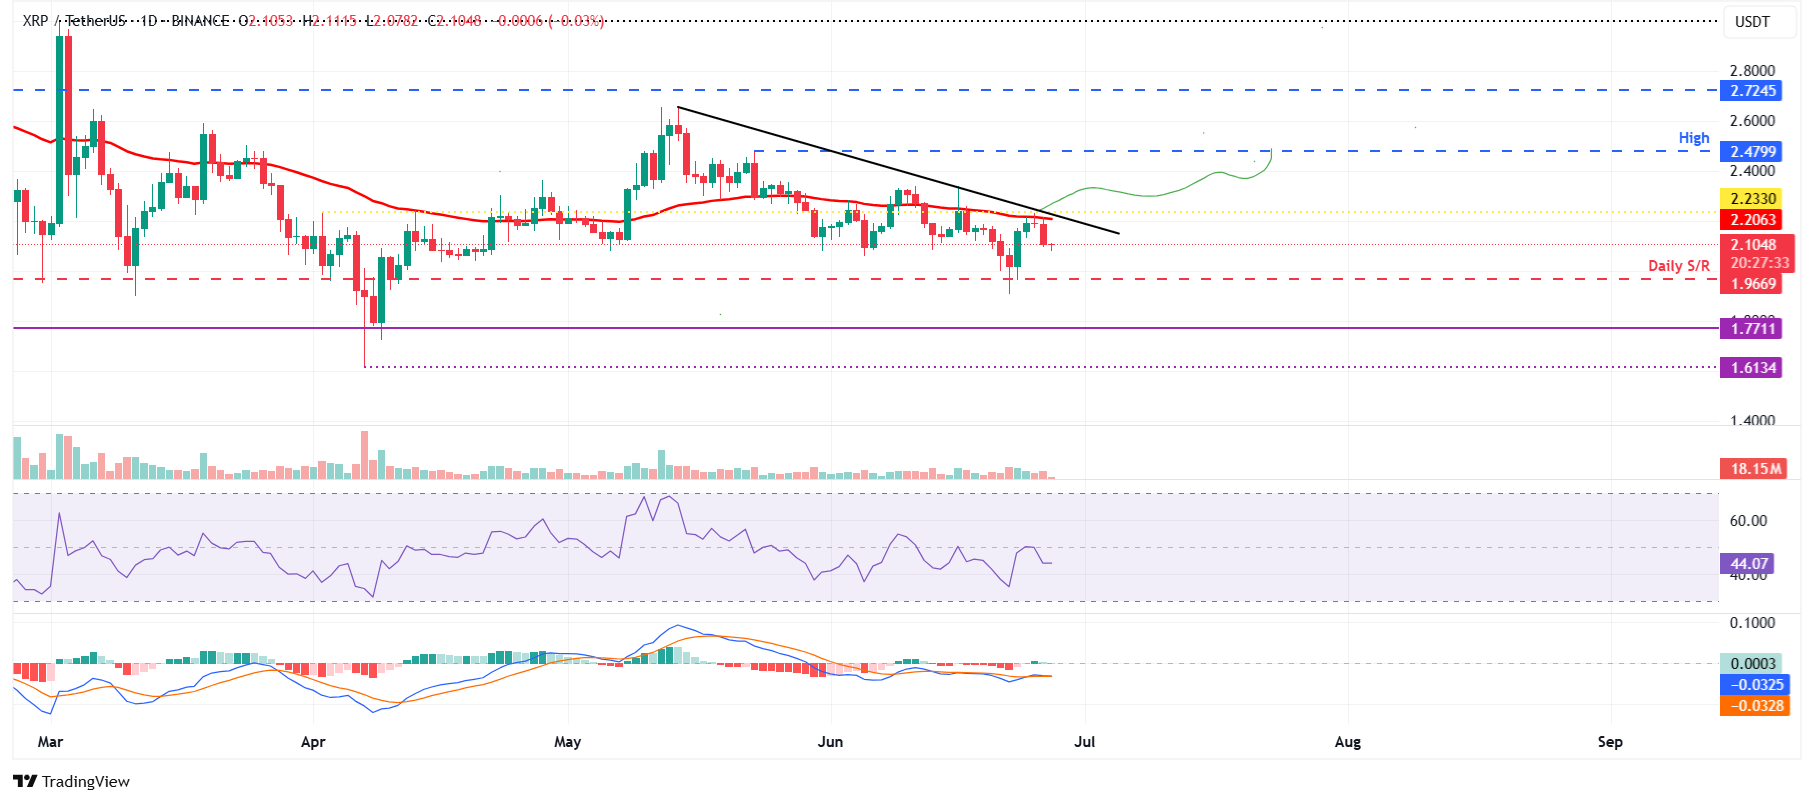
XRP/USDT daily chart
Conversely, if XRP continues its decline, it could extend the correction to retest its daily support at $1.96.
Bitcoin, altcoins, stablecoins FAQs
What is Bitcoin?
Bitcoin is the largest cryptocurrency by market capitalization, a virtual currency designed to serve as money. This form of payment cannot be controlled by any one person, group, or entity, which eliminates the need for third-party participation during financial transactions.
What are altcoins?
Altcoins are any cryptocurrency apart from Bitcoin, but some also regard Ethereum as a non-altcoin because it is from these two cryptocurrencies that forking happens. If this is true, then Litecoin is the first altcoin, forked from the Bitcoin protocol and, therefore, an “improved” version of it.
What are stablecoins?
Stablecoins are cryptocurrencies designed to have a stable price, with their value backed by a reserve of the asset it represents. To achieve this, the value of any one stablecoin is pegged to a commodity or financial instrument, such as the US Dollar (USD), with its supply regulated by an algorithm or demand. The main goal of stablecoins is to provide an on/off-ramp for investors willing to trade and invest in cryptocurrencies. Stablecoins also allow investors to store value since cryptocurrencies, in general, are subject to volatility.
What is Bitcoin Dominance?
Bitcoin dominance is the ratio of Bitcoin's market capitalization to the total market capitalization of all cryptocurrencies combined. It provides a clear picture of Bitcoin’s interest among investors. A high BTC dominance typically happens before and during a bull run, in which investors resort to investing in relatively stable and high market capitalization cryptocurrency like Bitcoin. A drop in BTC dominance usually means that investors are moving their capital and/or profits to altcoins in a quest for higher returns, which usually triggers an explosion of altcoin rallies.

Log in to Reply
Log in to comment your thoughtsComments
Related Articles
|Square
Get the BTCC app to start your crypto journey
Get started today Scan to join our 100M+ users