🚀 Tron Price Forecast: Tether’s USDT Dominance Hits $80B on Tron – What’s Next?

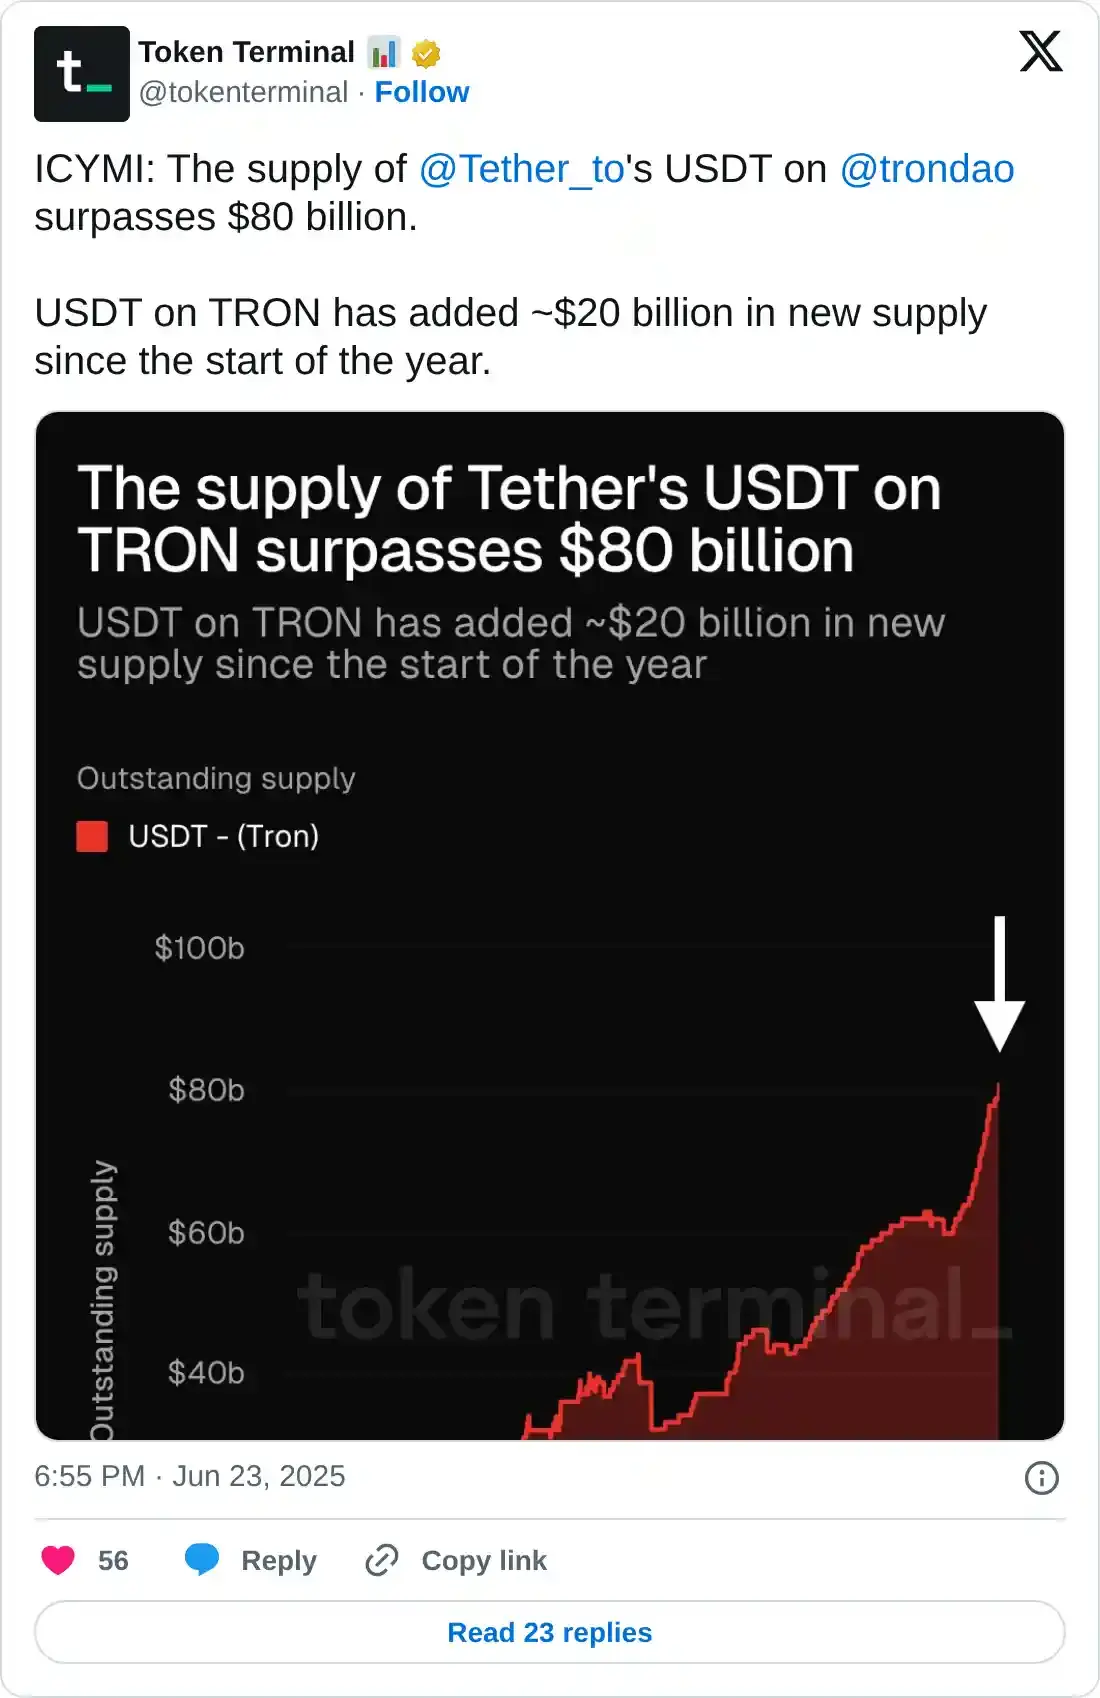
Tron’s ecosystem just hit a jaw-dropping milestone—Tether’s USDT supply on the network has rocketed past $80 billion. That’s not just a number; it’s a seismic shift in stablecoin dominance. Here’s why it matters.
### The Stablecoin King Flexes Its Muscles
USDT isn’t just surviving on Tron—it’s thriving. With $80 billion now parked in the network, Tether’s grip on the stablecoin market tightens. Traders are voting with their wallets, and the message is clear: speed and low fees win.
### What This Means for TRX
More USDT means more liquidity, more transactions, and—let’s be real—more speculation. Tron’s price could see fireworks if this momentum keeps up. Or, in classic crypto fashion, a rug pull disguised as a ‘correction.’
### The Cynical Take
Wall Street’s still figuring out ETFs, while Tron’s out here moving $80 billion like it’s a casual Tuesday. Maybe banks should start taking notes—or just buy the dip.
Tron’s stablecoin supply hit a new all-time high
Token Terminal data indicate that Tether’s USDT supply on TRON’s blockchain has been steadily rising and reached a milestone of $80 billion on Tuesday, marking a new all-time high and a $20 billion increase since January. Such stablecoin activity and value increase on the TRX project indicate a bullish outlook, as it boosts network usage and can attract more users to the ecosystem, driven by Decentralized Finance (DeFi), meme coins, and payment use cases.
Tron Price Forecast: TRX rebounds after retesting its 100-day EMA
Tron price dipped 2.7% on Sunday and retested its 200-day Exponential Moving Average (EMA) at $0.259, which coincided with the daily support level and recovered 3.49% the next day. At the time of writing on Tuesday, it trades at around $0.272.
If the 200-day EMA at $0.259 continues to hold as support, TRX could extend the recovery toward the next daily resistance at $0.296.
The Relative Strength Index (RSI) reads 49, approaching its neutral level of 50, indicating fading bearish momentum. For the bullish momentum to be sustained, the RSI must MOVE above its neutral level of 50, which will support the recovery ahead.
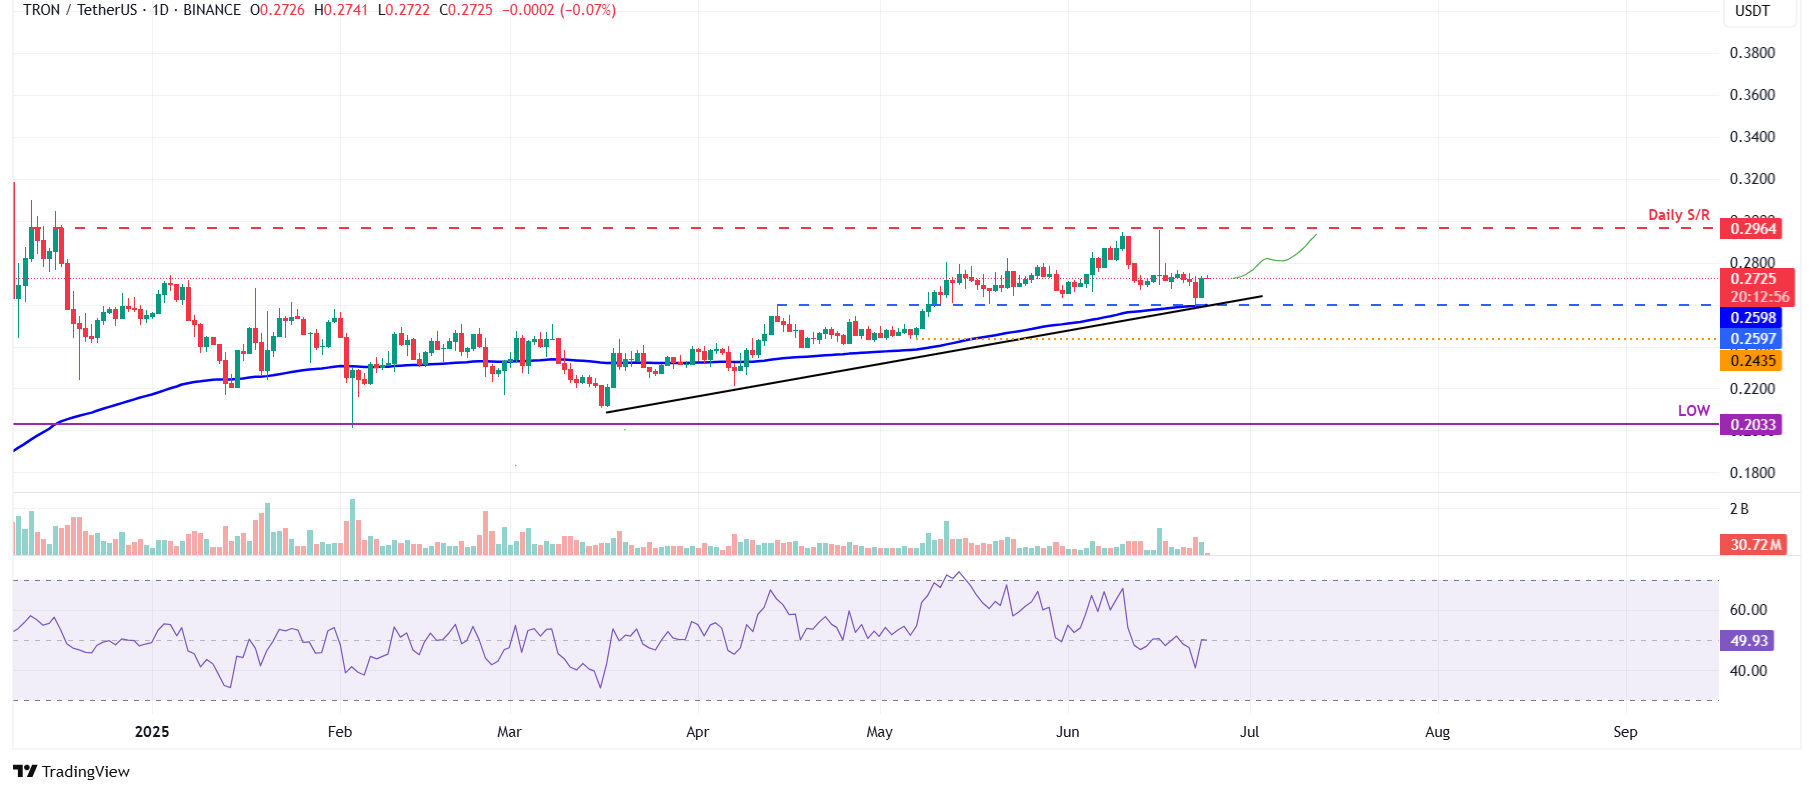
TRX/USDT daily chart
However, if TRX fails to find support around the 200-day EMA at $0.259 and closes below it, the correction could extend to retest its May 7 low of $0.243.

Log in to Reply
Log in to comment your thoughtsComments
Related Articles
|Square
Get the BTCC app to start your crypto journey
Get started today Scan to join our 100M+ users