🚀 SEI, WIF, VIRTUAL Soar 20%+ as Middle East Tensions Ease—Here’s Where Crypto Goes Next

Crypto markets pumped the brakes on geopolitical fear—and pumped altcoins instead. Three tokens defied gravity while traditional investors scrambled for safe havens.
The rally nobody predicted
SEI, WIF, and the memecoin VIRTUAL ripped double-digit gains within hours of Israel-Iran ceasefire rumors. Retail traders front-ran institutional money yet again—proving crypto's knack for discounting geopolitical risk faster than CNBC anchors can say 'flight to quality.'
When narratives trump fundamentals
No major protocol upgrades or partnership news fueled these moves. Just the oldest crypto catalyst in the book: capital rotating out of 'safe' assets like gold (down 1.2%) into high-beta altcoins. Traders clearly bet that détente means risk-on—though anyone who lived through 2022 knows ceasefires can reverse faster than a leveraged long position.
The cynical take
Wall Street will spin this as 'digital assets maturing.' Truth? Crypto still trades like a volatility ETF with a Twitter addiction. One Middle East headline away from double-digit swings—and still the only market where 'geopolitical stability' counts as a bullish narrative.

Donald Trump's ceasefire announcement. Source: Truth Social
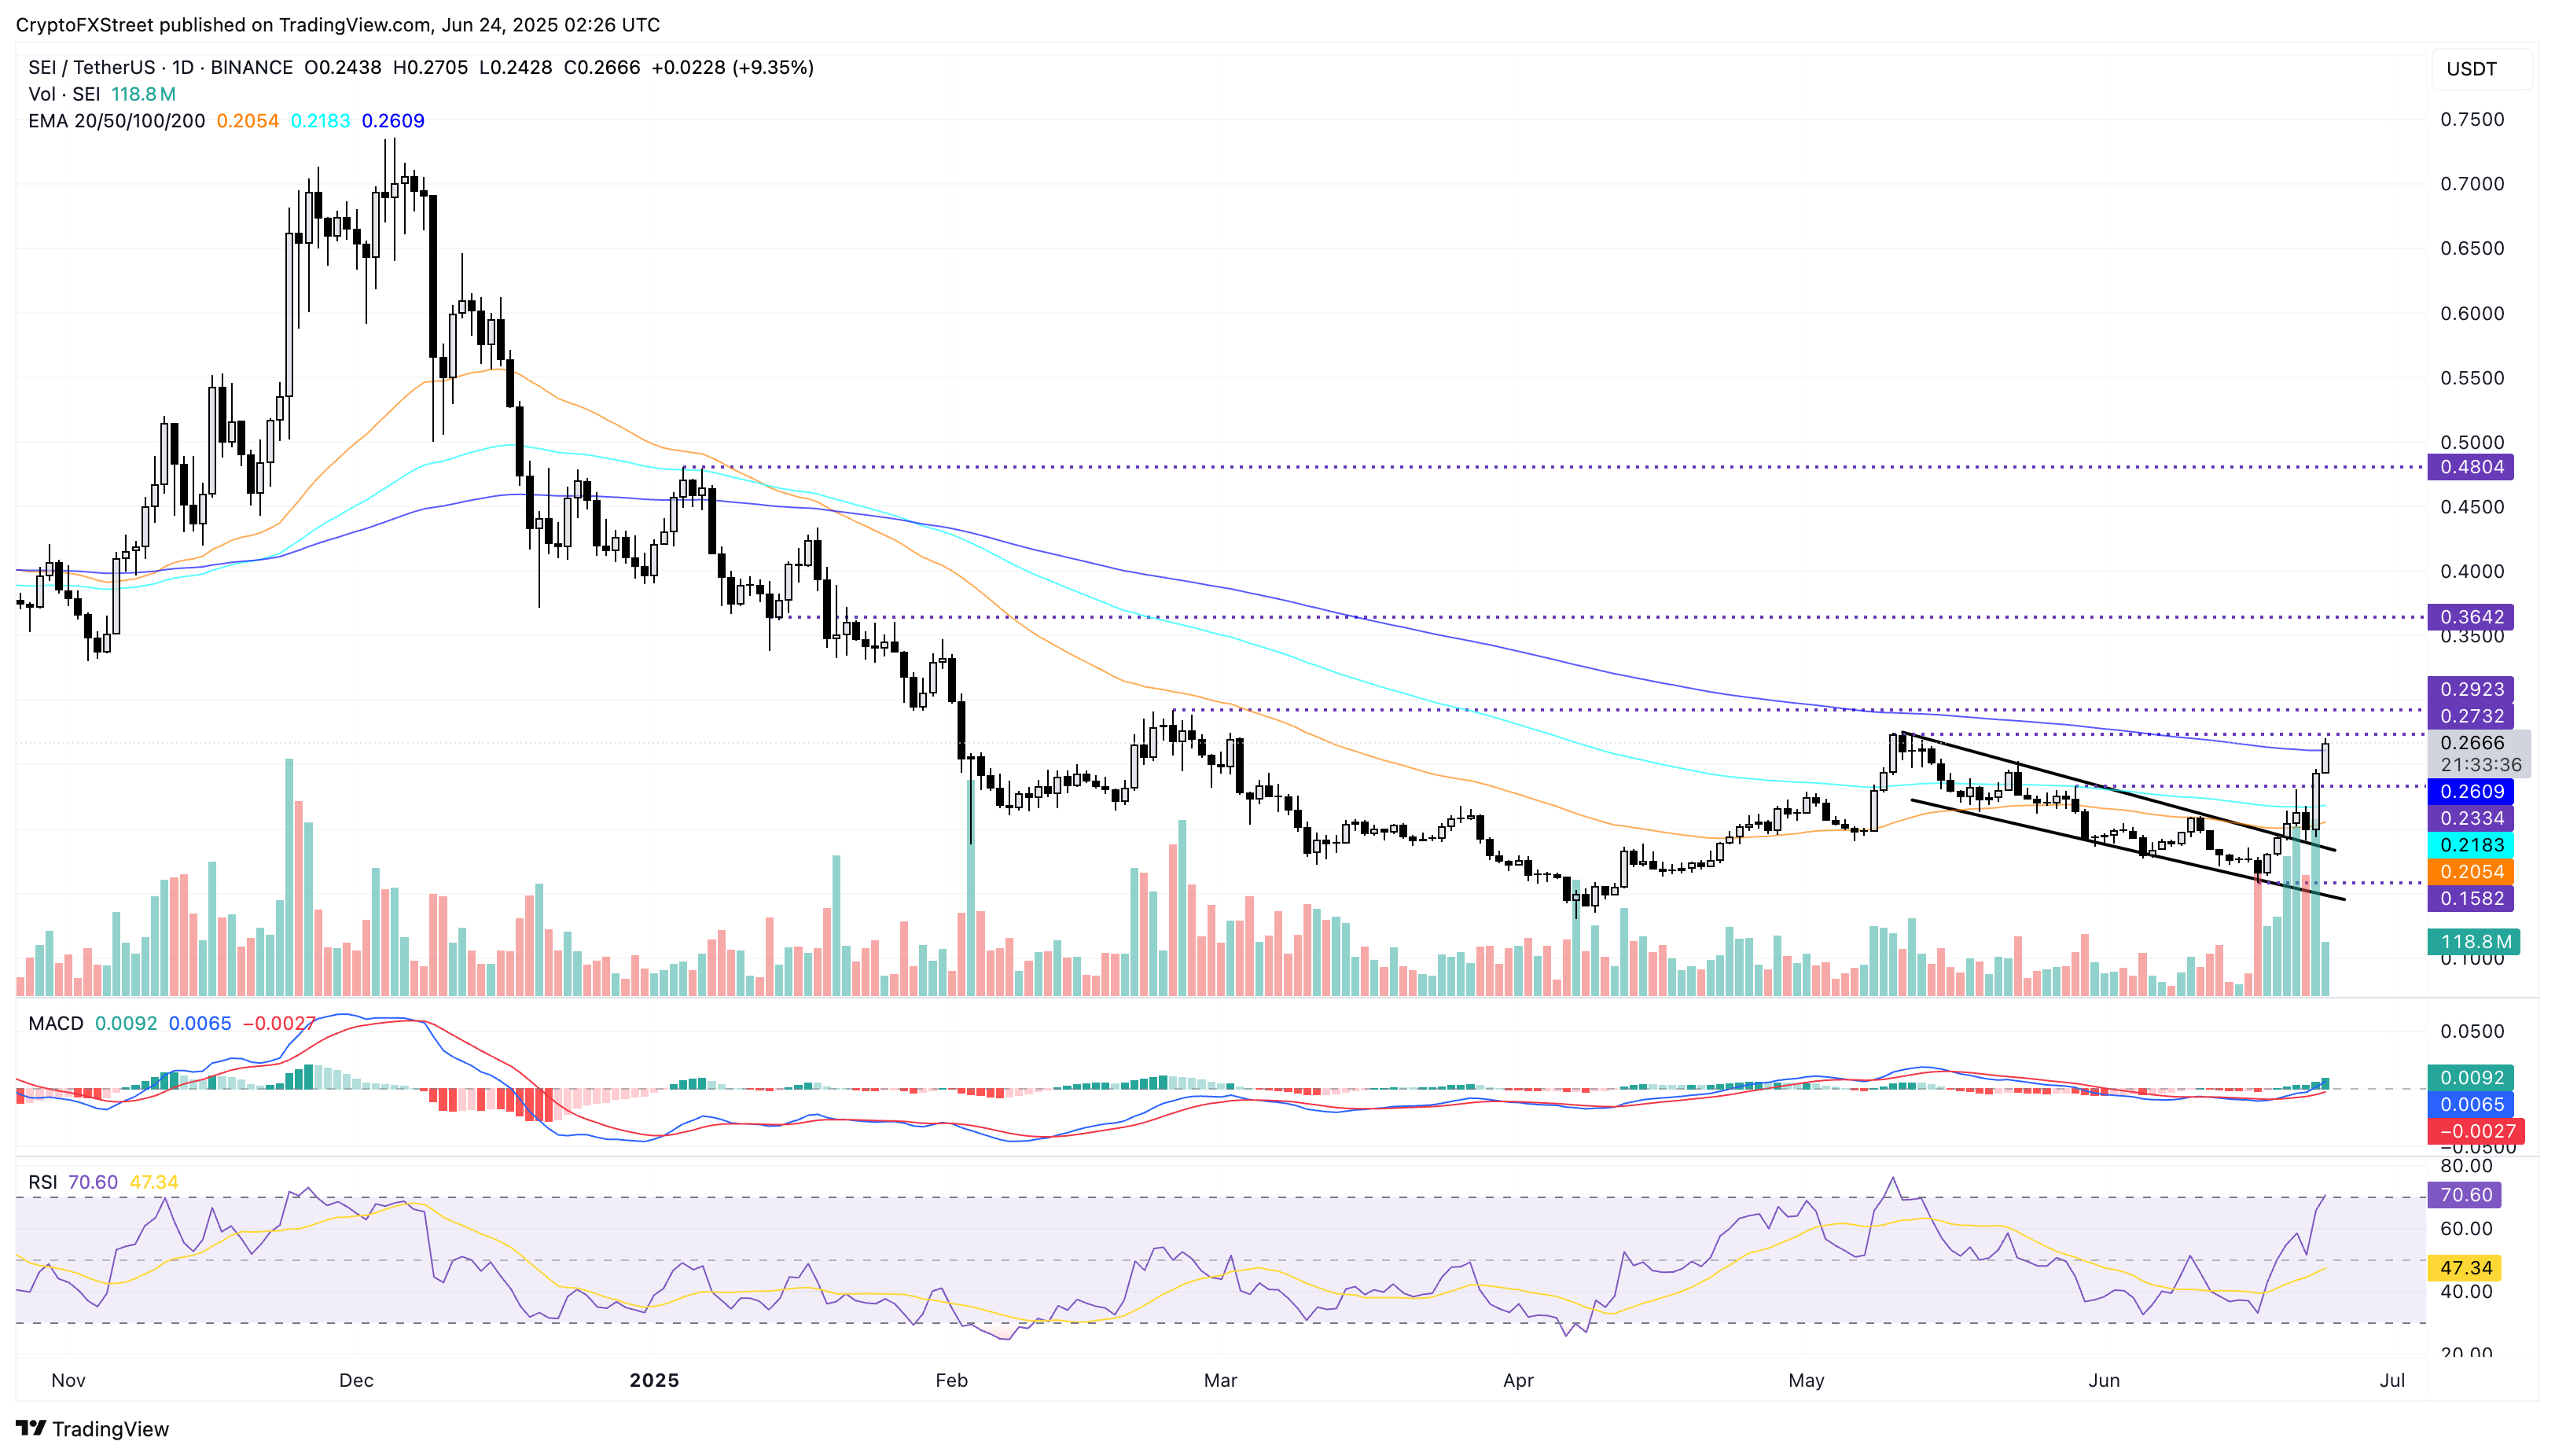
SEI Price Forecast: Recovery rally targets two-month high
Sei edges higher by 9% at press time on Tuesday, extending its 22% gains from Monday. The recovery run exceeds the 200-day Exponential Moving Average (EMA) at $0.2609 with the second bullish candle in making.
Aiming towards $0.2732, May’s high, SEI recovery shows potential to reach a new 60-day high. Furthermore, the $0.2923 level marks the highest price since February, acting as the follow-up resistance.
A clean push above $0.2923 could extend Sei’s uptrend towards the $0.3642 level, last tested on January 21.
Turning to momentum indicators, a surge in bullish momentum is evident. The Moving Average Convergence/Divergence (MACD) indicator crosses above the zero line with its signal line, triggering a buy signal. A fresh wave of green histogram bars from the zero line suggests a new bullish trend in motion.
The Relative Strength Index (RSI) at 70 indicates a spike in buying pressure as it approaches the overbought zone. However, investors must exercise caution amid the increased risk of a pullback during overbought conditions.
WIF/USDT daily price chart.
If the altcoin fails to close above the 200-day EMA, a retest of the 100-day EMA at $0.2183 is possible.
WIF Price Forecast: Morning star pattern revives bullish hope
Dogwifhat edges higher at press time on Tuesday, holding the 20% gains from the previous day. A bullish engulfing candle, formed by a 20% surge, completes a morning star pattern, coupled with an 8% drop on Saturday, followed by a Doji candle.
Typically, the pattern indicates a trend reversal after a downfall, projecting upside chances for WIF. The recovery rally challenges the sideways-moving 50-day and 100-day EMAs NEAR $0.85. A closing above the dynamic resistances could prolong the meme coin’s recovery towards the $1.00 round figure.
The MACD indicator nears its signal line, indicating a high likelihood of a potential bullish crossover that could trigger a new wave of bullish histograms from the zero line. Investors could consider the potential crossover as a trend reversal signal.
The RSI at 48 nears the halfway level, with a sharp reversal from near the oversold boundary reflecting a resurgence in bullish momentum.
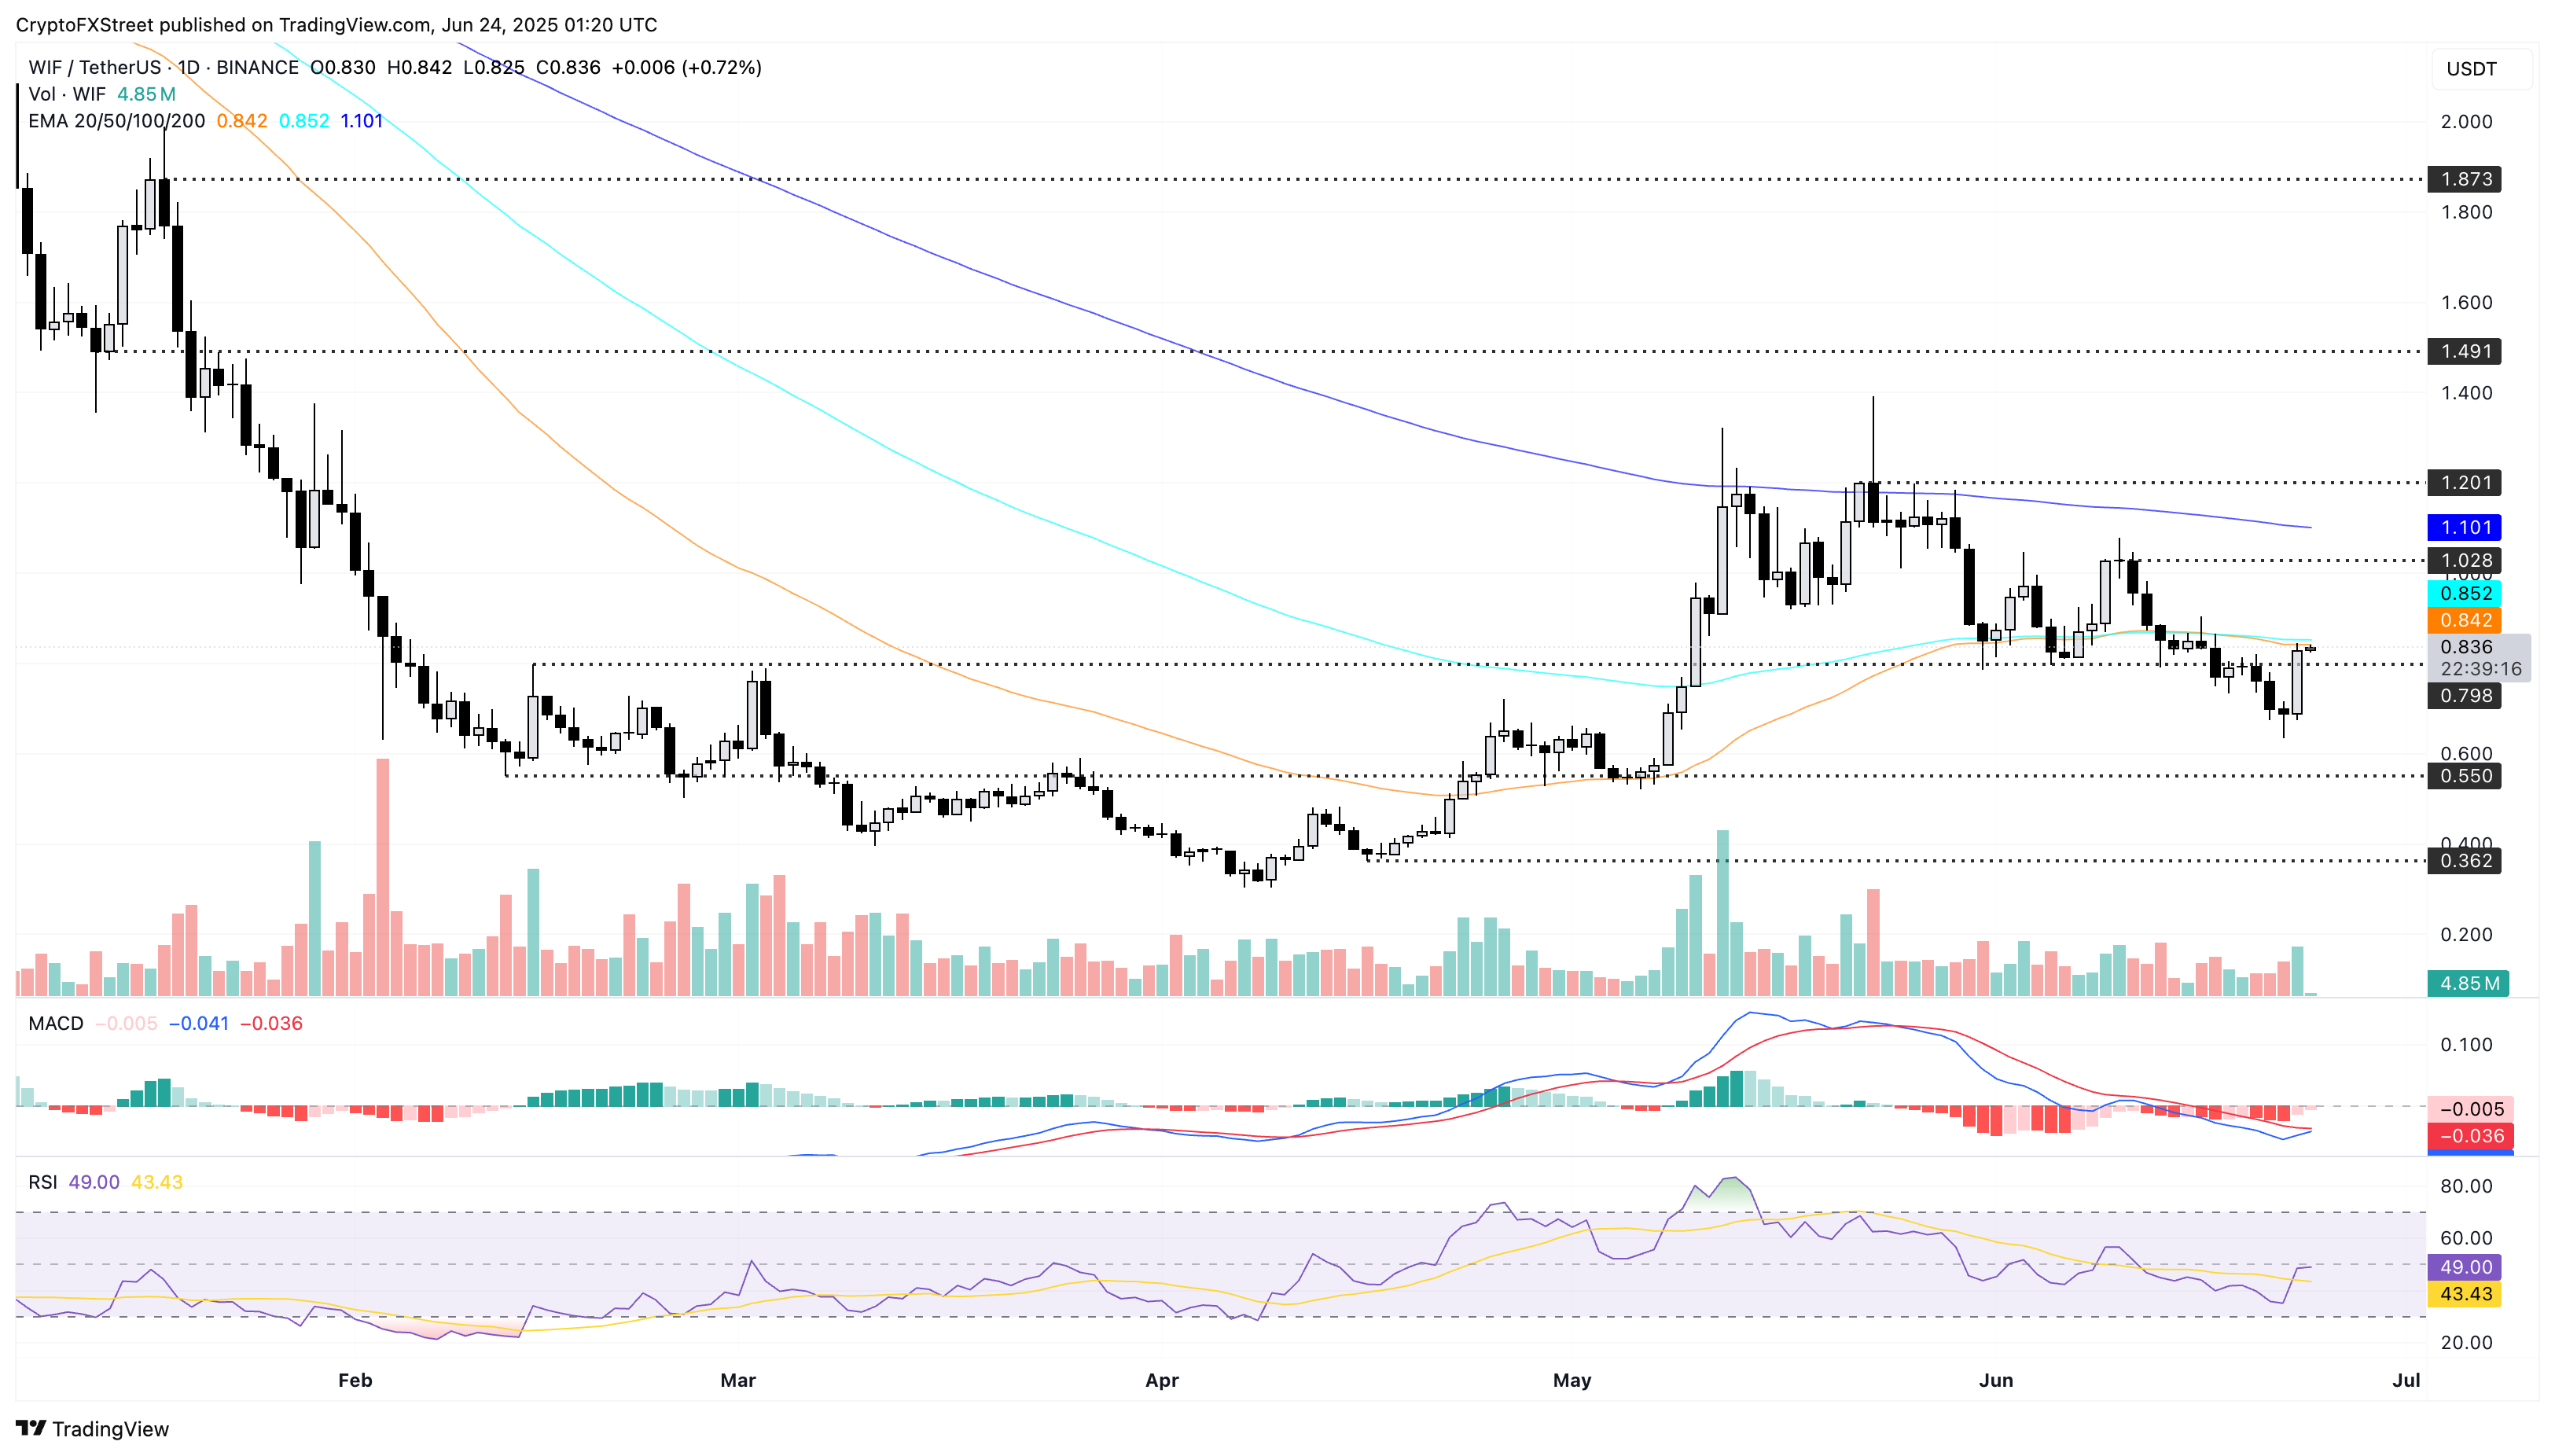
WIF/USDT daily price chart.
However, a failure to mark a bullish closing above the dynamic resistances could reverse the momentum, potentially towards the weekly low of $0.63.
VIRTUAL Price Forecast: Bulls target 50-day EMA breakout
Virtuals Protocol ticks lower by 2% at press time on Tuesday following the 23% surge on Monday stemming from the 200-day EMA at $1.39. Similar to WIF, the price action prints a morning star pattern to challenge the 50-day EMA at $1.71.
A closing above the moving average could prolong the uptrend towards the overhead trendline formed by the declining highs on January 2, May 27, and June 11, near the $2.00 round figure.
The momentum exhibits a gradual bullish shift, as evident by the MACD indicator nearing a bullish crossover, with its signal line indicating a potential trendline reversal. Similarly, the RSI at 46 takes a sharp reversal towards the halfway line, indicating a boost in buying pressure.
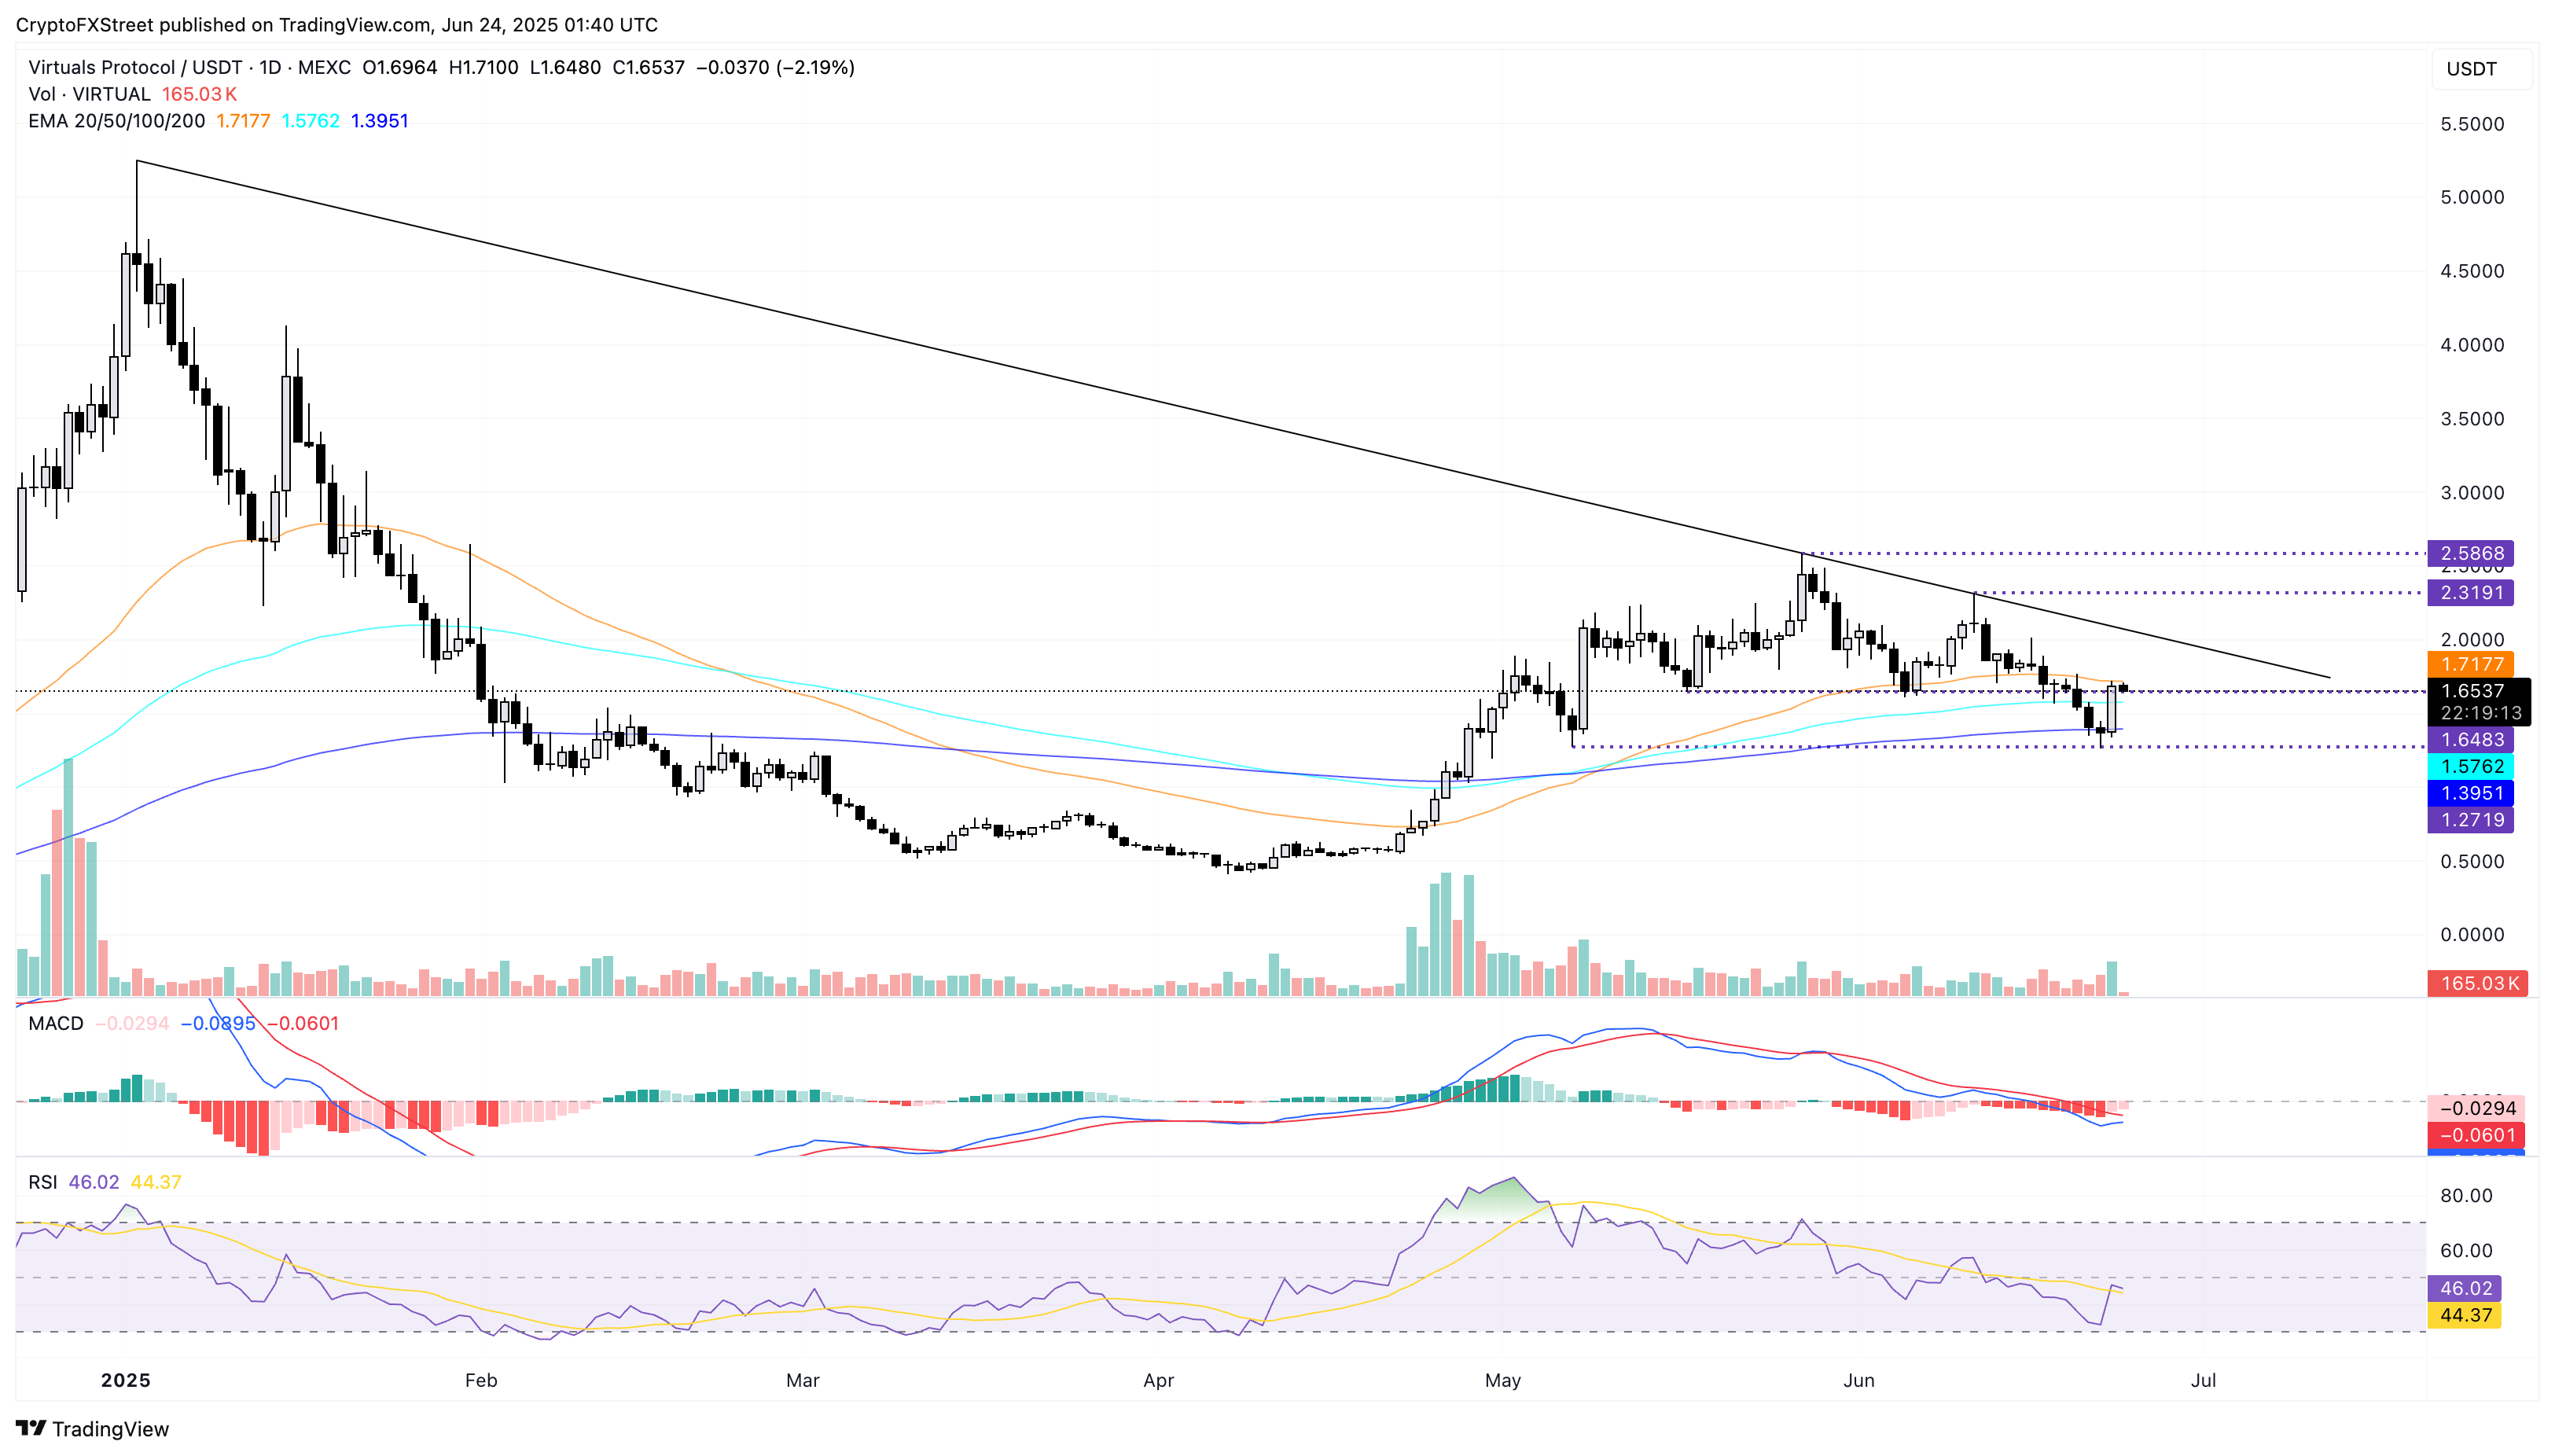
VIRTUAL/USDT daily price chart.
If VIRTUAL fails to cross above the 50-day EMA at $1.71, it could retest the 100-day EMA at $1.57.
