BNB Price Forecast: Brace for Impact as Sell-Off Wave Threatens 10% Plunge

BNB faces mounting pressure as liquidation signals flash red across trading desks.
The Perfect Storm
Selling momentum accelerates beyond critical support levels, mirroring patterns last seen during major market corrections. Technical indicators suggest no immediate relief in sight.
Domino Effect
Whale movements and leveraged positions create cascading sell pressure that could trigger stop-losses across multiple trading tiers. The 10% downside risk represents just the initial wave.
Market Psychology
Traders exhibit classic herd behavior—panicking at precisely the wrong moment while traditional finance analysts nod sagely about 'speculative bubbles' from their leather armchairs.
Bottom Line: This isn't a drill. The charts scream caution while the fundamentals whisper opportunity—typical crypto whiplash that separates diamond hands from paper portfolios.
Sell-side dominance arises in BNB derivatives
CoinGlass data indicates that the BNB Open Interest has decreased by 3.56% over the last 24 hours, now standing at $1.84 billion. This significant capital outflow from BNB derivatives indicates a risk-off sentiment among traders.
Adding to the lowered interest, the OI-weighted funding rate has dropped to 0.0062% from 0.0091% earlier in the day. Furthermore, the long liquidations of $11.91 million in the last 24 hours outpace short liquidations at $721,610, indicating a larger wipeout of bullish-aligned traders.
Finally, the 24-hour long-to-short ratio reads 0.9279, indicating that a greater number of short positions are active, suggesting a sell-side dominance.
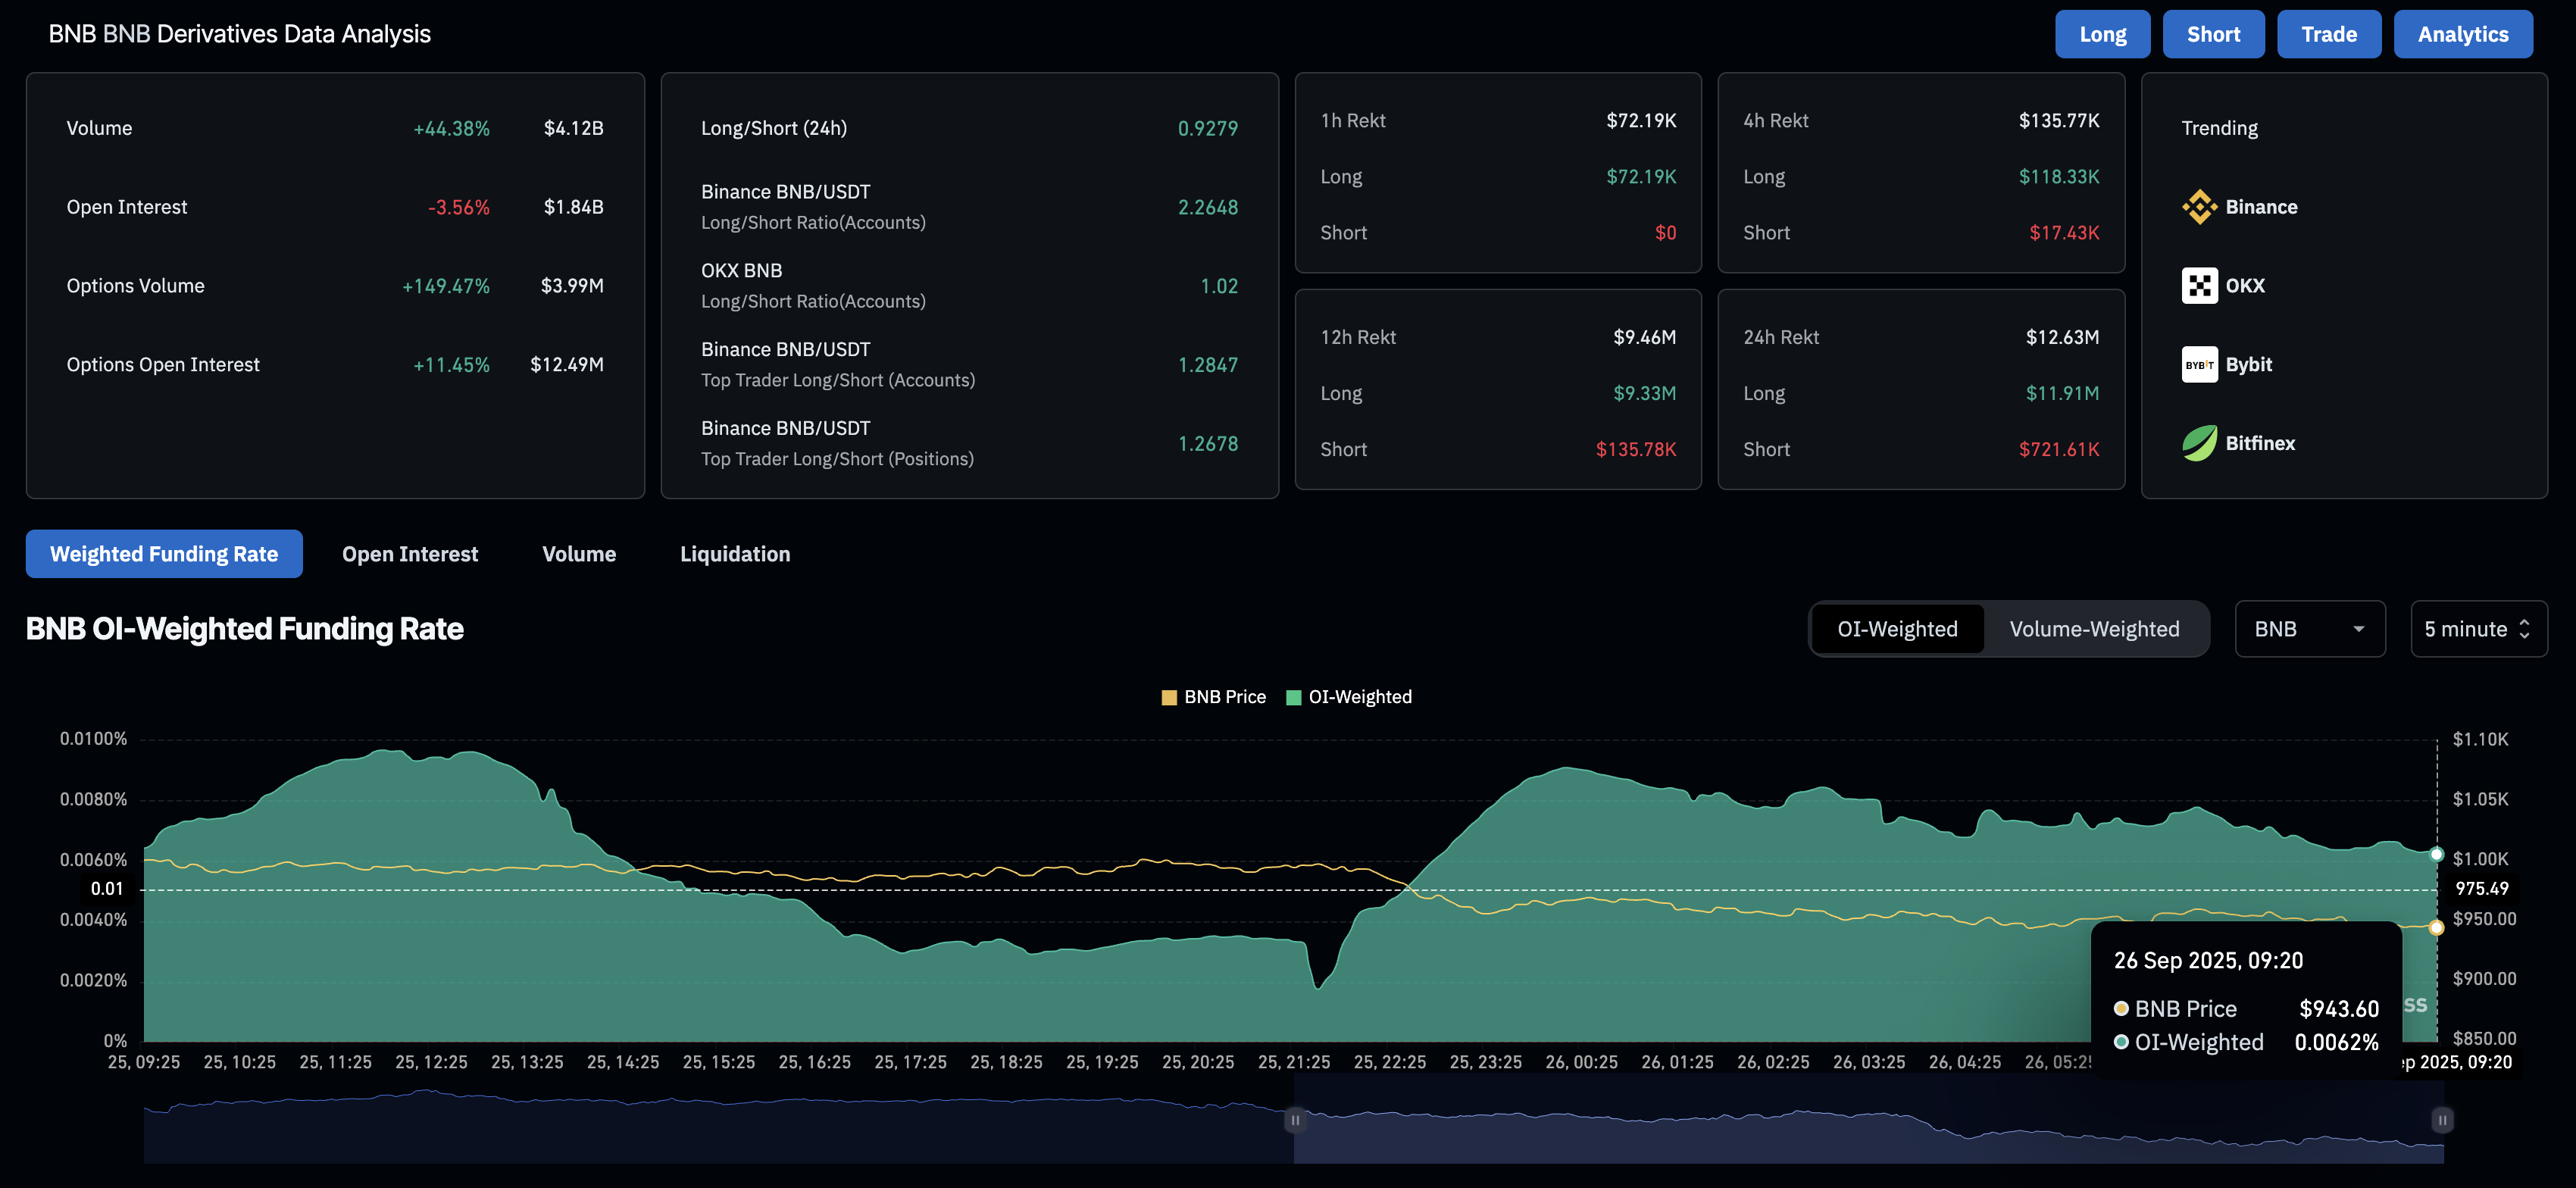
BNB derivatives. Source: CoinGlass
BNB risks channel breakdown as buying pressure wanes
BNB is approaching the lower boundary line of a rising channel pattern on the daily chart. The Centralized Exchange (CEX) token reversed from the overhead trendline at its all-time high of $1,083 on Sunday, igniting the current downcycle within the parallel channel.
To confirm the channel fallout, BNB bears must achieve a decisive close below the R1 pivot level, which serves as resistance-turned-support at $928. A potential downside breakout could extend the decline to the 50-day Exponential Moving Average (EMA) at $895, followed by the centre pivot level at $829.
The technical indicators on the daily chart reflect a decrease in buying pressure, which increases the chances of a potential breakdown. The Moving Average Convergence Divergence (MACD) extends the downside movement after crossing below its signal line on Thursday, indicating a rise in bearish momentum.
Additionally, the Relative Strength Index (RSI) reads 50 on the same chart, marking a significant decline from the overbought zone as buying pressure wanes.
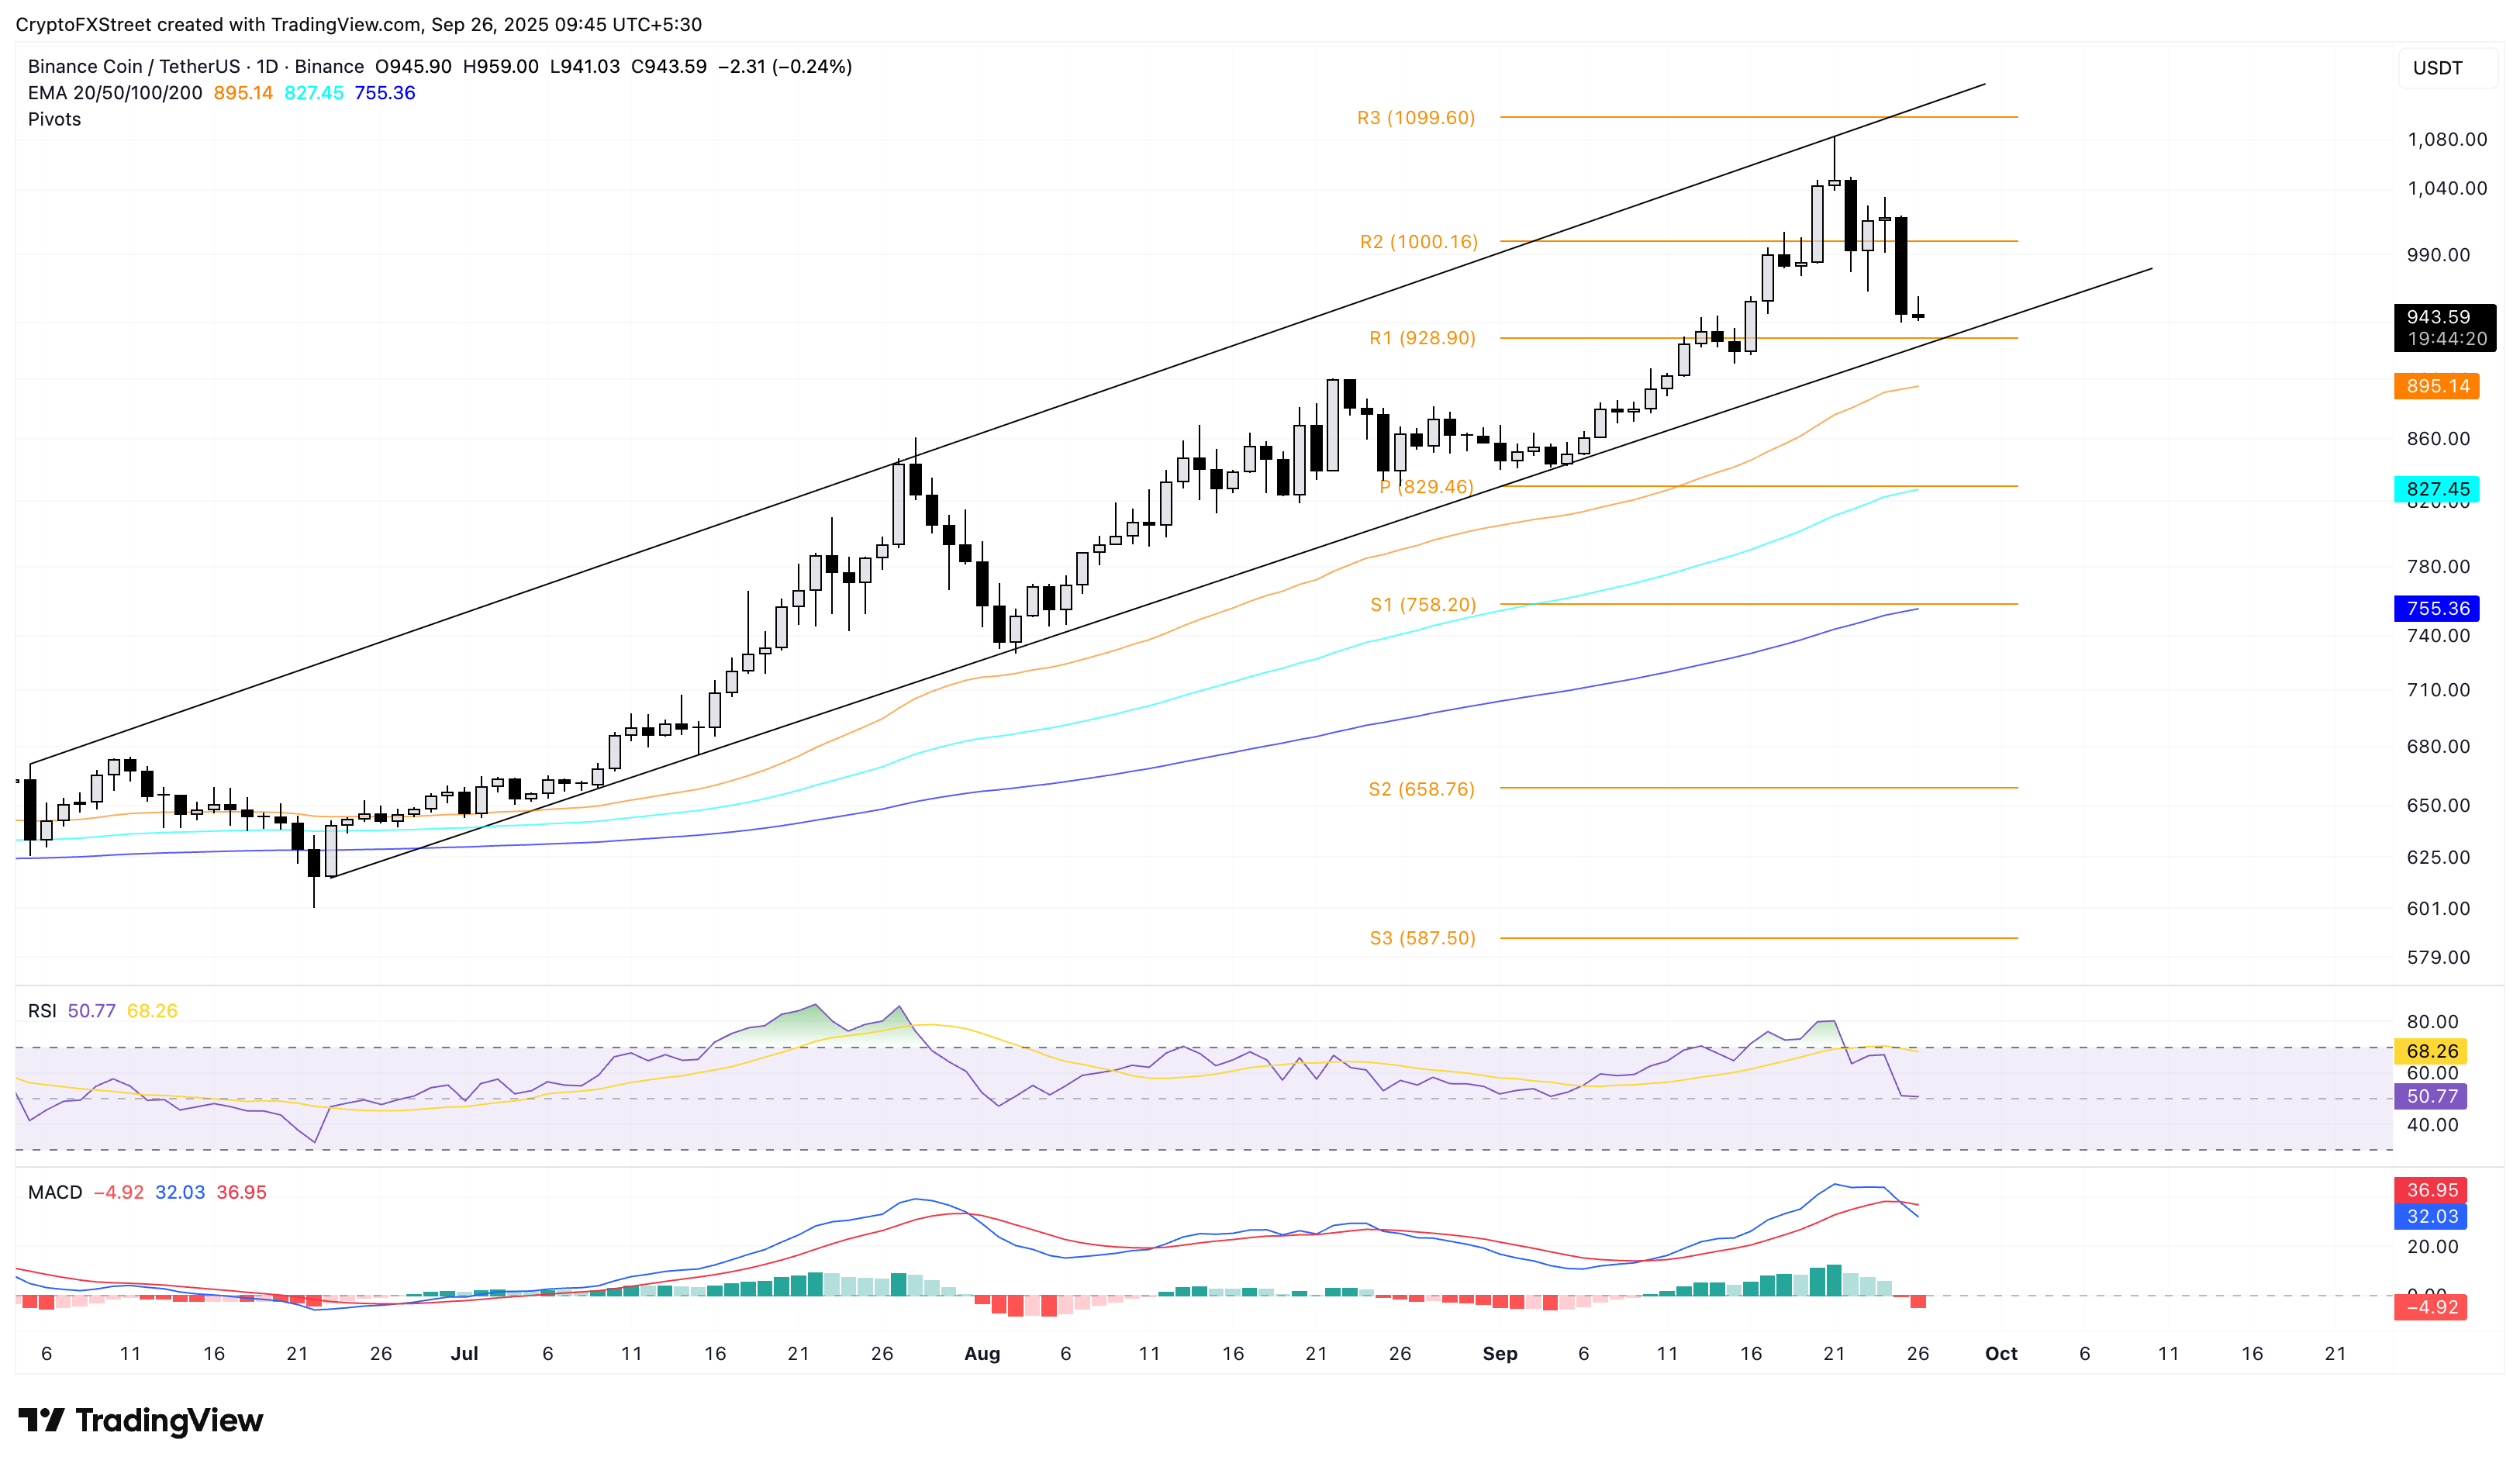
BNB/USDT daily price chart.
On the upside, if BNB rebounds from $928, it could retest the R2 resistance at $1,000 psychological milestone.
