Bitcoin Bull Run Countdown: Critical Timeline Revealed for 2025

Mark your calendars—the crypto market's next major surge is taking shape.
Timing the Tidal Wave
Historical patterns and institutional inflows point toward a specific window for Bitcoin's next explosive move. Market indicators that flashed before previous bull runs are aligning once again.
The Institutional Catalyst
Wall Street's gradual embrace of digital assets creates a pressure cooker scenario. When traditional finance fully engages, the dam breaks—every time.
Technical Breakout Signals
Key resistance levels are being tested with unusual volume patterns. The charts don't lie, though traditional analysts still try to explain them away with 'efficient market theory.'
Regulatory clarity acts as the final domino. Once major economies establish clear frameworks, the institutional floodgates open wider than a banker's bonus expectations.

Bitcoin, the pioneer cryptocurrency, has slipped to a four-week low, trading under $109,500, leaving many traders anxious about its next move. But veteran analyst Timothy Peterson believes the drop could just be part of a bigger setup.
Using Bitcoin’s 10-year seasonality trends, he suggests the BTC to climb as high as $200,000 by June 2026, and even higher if seasonality repeats.
Bitcoin Bull Run Timeline
In his analysis, Peterson highlighted Bitcoin’s 10-year seasonality chart, which tracks the asset’s typical behavior over the course of a year. Instead of looking at the calendar year, he shifted the timeline by six months to better capture Bitcoin’s bull cycles.
According to his research, Bitcoin’s strongest performance window runs from October 11 to June 11. Historically, this period has produced the steepest gains in Bitcoin’s cycle.
If history repeats itself, Bitcoin could climb at an average pace of 7% per month, which works out to around 120% yearly gains.
Bitcoin Price Prediction
According to analyst Peterson, bitcoin now has a 50% or higher chance of reaching $200,000 by June 2026. That would mean the price would nearly double from current levels in less than a year.
In a stronger rally, the move could stretch even further, with Bitcoin potentially climbing toward $240,000 later in the cycle.
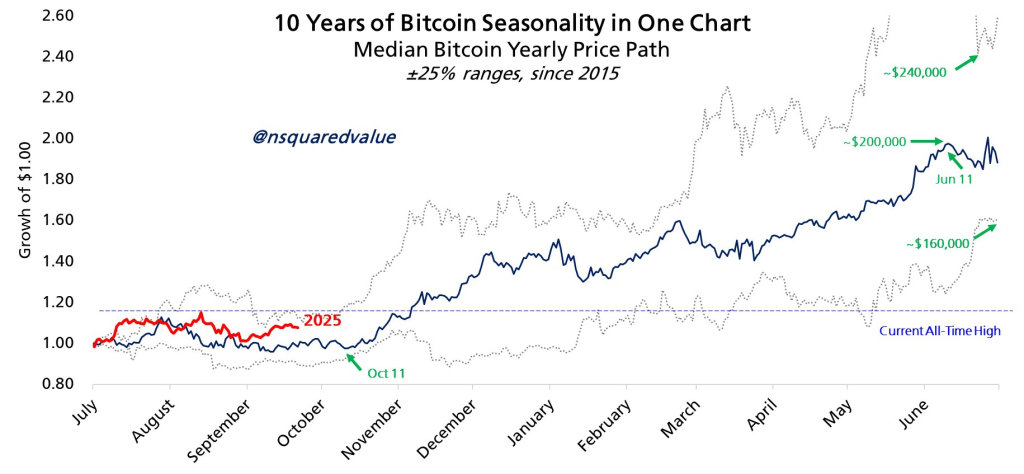
Peterson also highlighted early November as a key period to watch, since Bitcoin has a history of breaking into new all-time highs around that time. Therefore, Peterson suggests that a more cautious MOVE could see Bitcoin climb toward $160,000 as the first major milestone.
BTC Price Forecast – Short Term
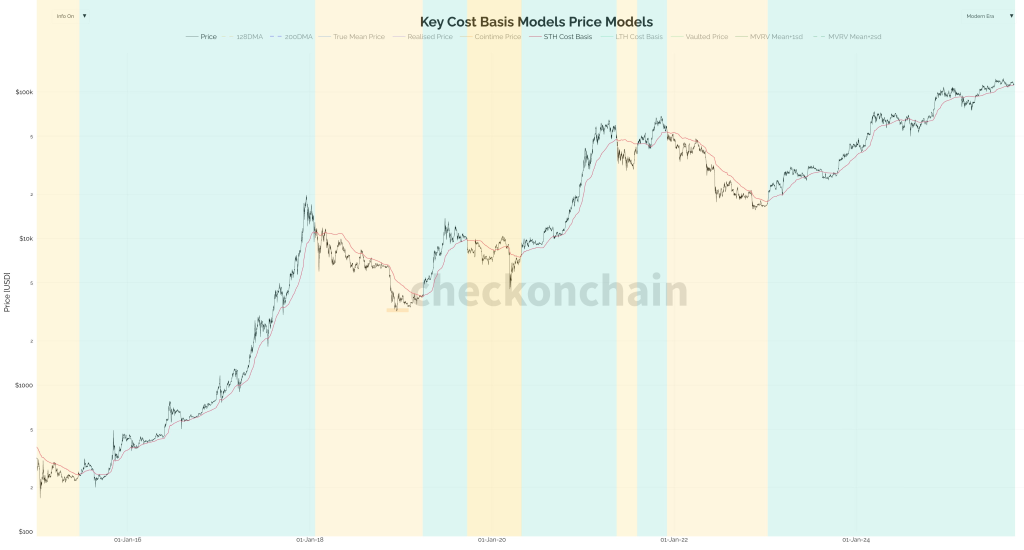
As of now, Bitcoin price is trading at $109,422, down 3% in the past 24 hours, erasing billions from the market. Meanwhile, a key factor that analysts are watching closely is the Short-Term Holder (STH) Cost Basis, currently at $111,500.
This level is increasingly seen as a critical line between bullish and bearish market behavior. Thus, the immediate support lies at $108,600, with stronger support NEAR $108,000.
A break below these levels may accelerate the downturn, potentially dragging Bitcoin toward the $105,000 zone, which could spark a wider market panic.
