Bitcoin, Ethereum, Ripple Price Prediction: BTC, ETH, XRP Find Stability Post-Correction Surge

Crypto giants regain footing after turbulent sell-off—what's next for the trifecta?
Market Analysis: The Calm After the Storm
Bitcoin claws back above key psychological levels while Ethereum's network activity hints at underlying strength. Ripple defies regulatory shadows with surprising resilience—proving once again that in crypto, traditional finance rules get rewritten daily.
Technical Outlook: Where the Charts Point
BTC's consolidation pattern suggests institutional accumulation continues behind the scenes. ETH's deflationary mechanism quietly burns tokens faster than hedge funds can print excuses. XRP's correlation breakdown signals either brilliant independence or impending volatility—take your pick.
The Road Ahead: Bulls vs Reality
With leverage flushed out and weak hands shaken, the stage sets for a potential leg up. Or as Wall Street would call it: 'unprecedented volatility' while they figure out how to tax it.
Bitcoin bears eye $107,000 mark
Bitcoin price failed to find support around the daily level of $116,000 on September 19 and declined 3.19% over the next four days, closing below the 50-day Exponential Moving Average at $113,490 on Monday. BTC recovered slightly on Wednesday, but failed to close above the 50-day EMA and declined 3.81% the next day, closing below the ascending trendline. At the time of writing on Friday, it trades at around $109,600.
If BTC continues to correct, it could extend the decline toward the daily support at $107,245.
The Relative Strength Index (RSI) on the daily chart reads 38, below its neutral level of 50, indicating bearish momentum. Meanwhile, the Moving Average Convergence Divergence (MACD) indicator showed a bearish crossover on Monday, giving a sell signal, which is still in effect. Moreover, the rising red histogram bars below the neutral level also suggest a bearish momentum and continuation of the downward trend.
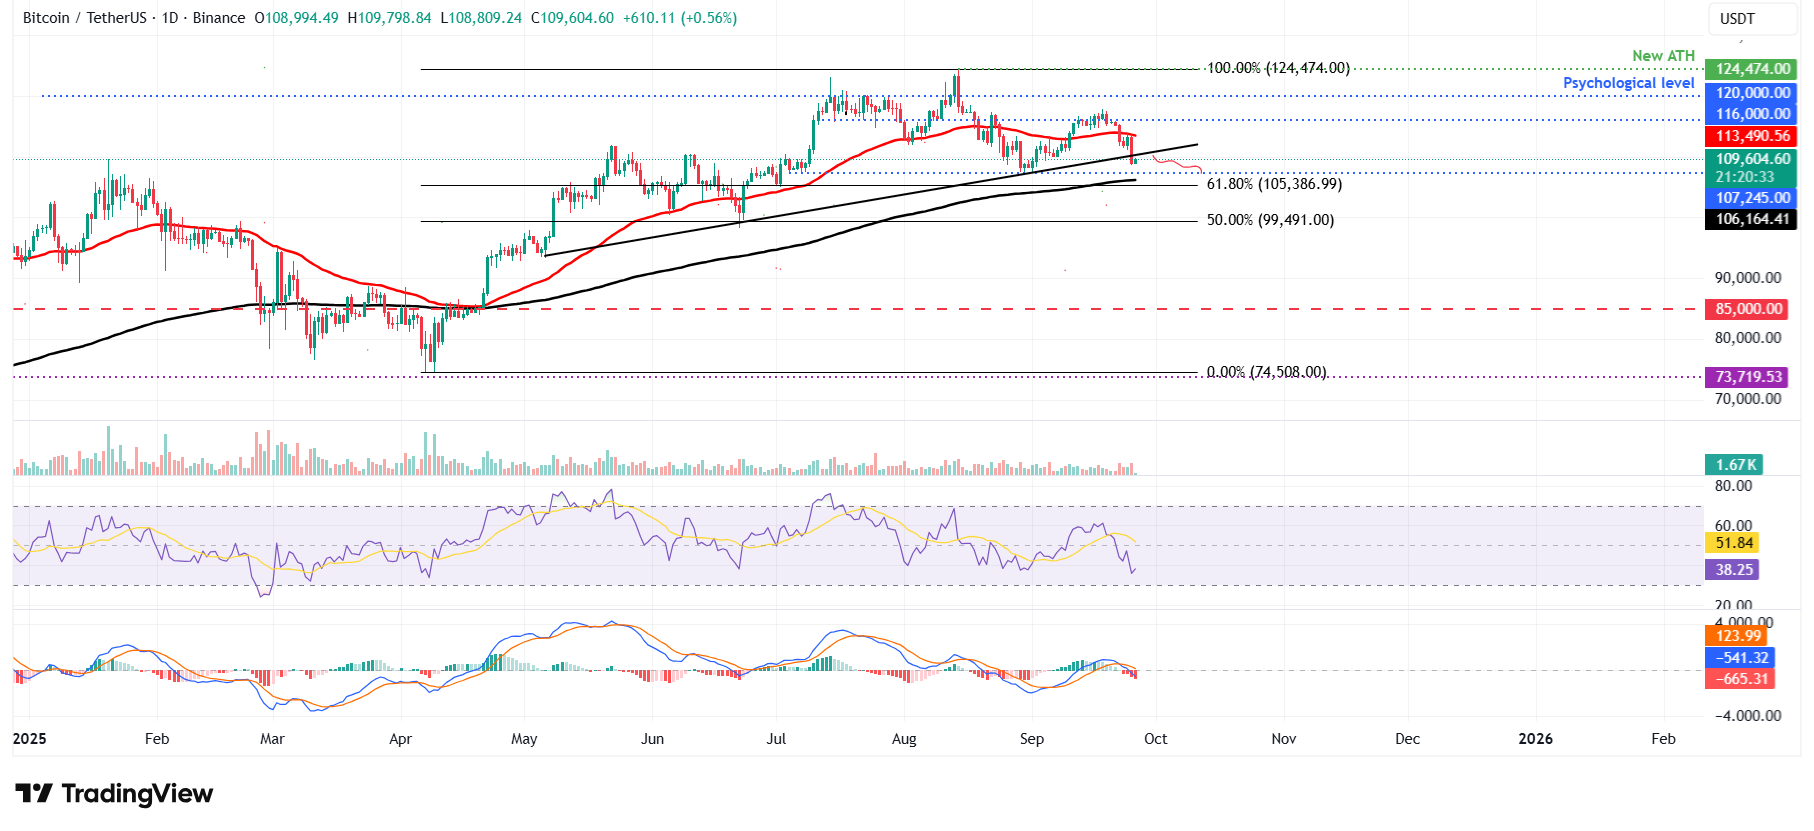
BTC/USDT daily chart
However, if BTC recovers, it could extend the rally toward the 50-day EMA at $113,490.
Ethereum may extend its downtrend if the 100-day EMA is taken
Ethereum price closed below the daily support level at $4,488 on September 19 and declined by 6.77% over the next four days, ultimately closing below the next daily support level at $4,232 on Tuesday. ETH continued its decline, dropping nearly 7% over the next two days, and closed below $3,900. At the time of writing on Friday, it recovers slightly after finding support around the 100-day EMA at $3,848.
If ETH closes below the 100-day EMA at $3,848 on a daily basis, it could extend the decline toward the next support at $3,593.
The RSI on the daily chart reads 35 after bouncing off the oversold level of 30 on Tuesday, indicating fading bearish momentum. However, like Bitcoin, Ethereum’s MACD indicators also support the bearish view, indicating the continuation of the downward trend.
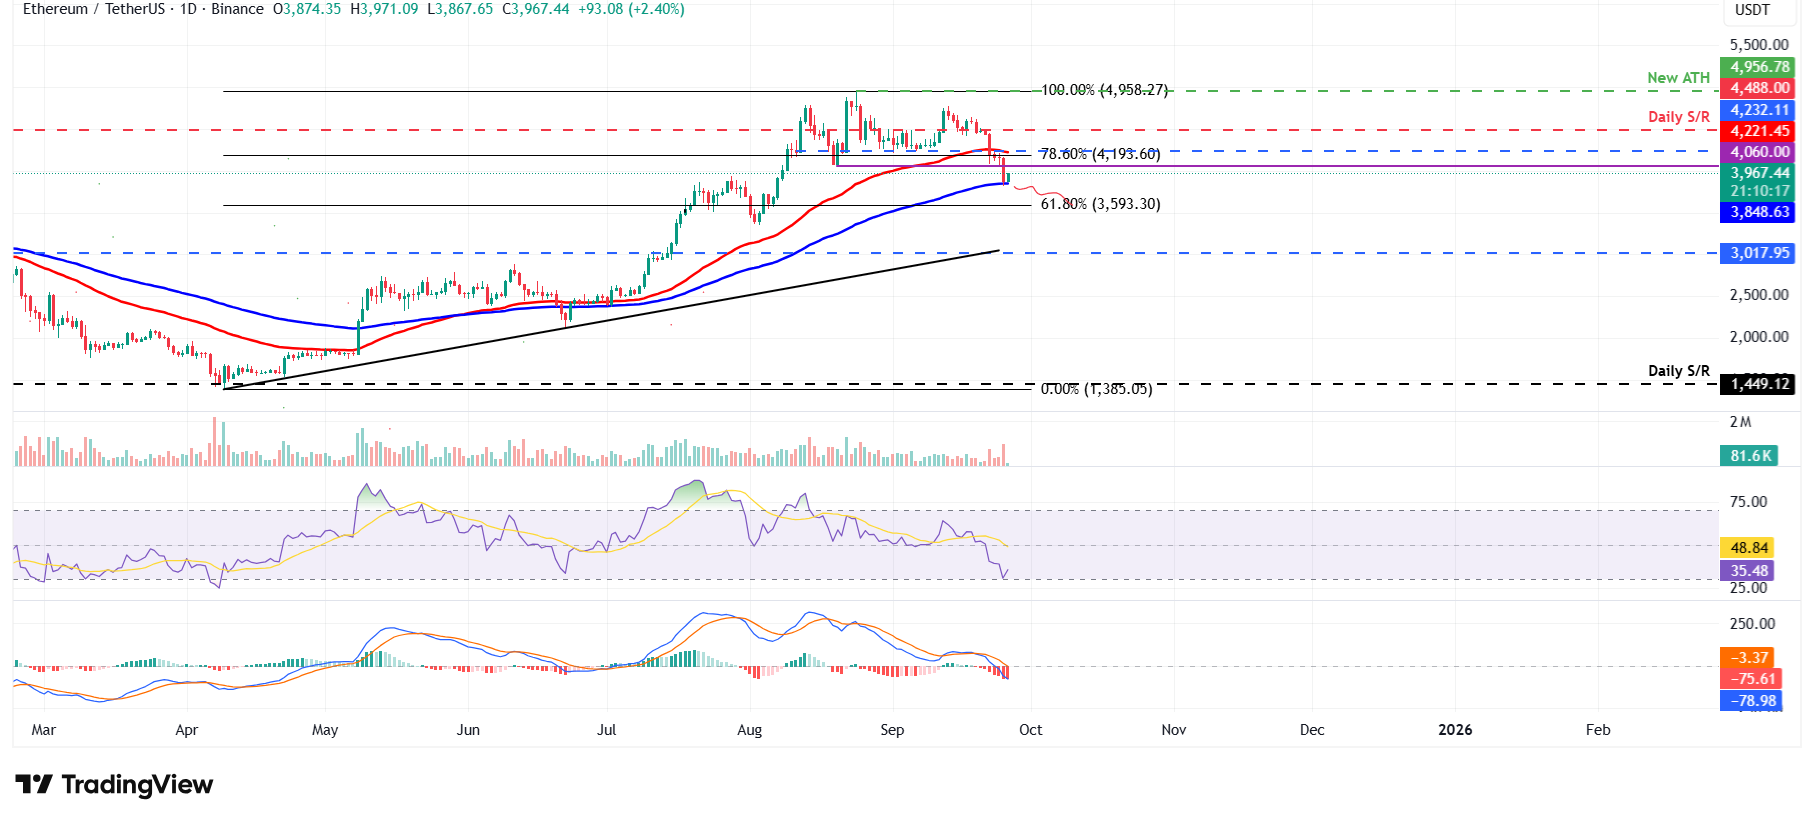
ETH/USDT daily chart
On the other hand, if ETH recovers, it could extend the recovery toward the daily resistance at $4,232.
XRP bears are in control of the momentum
Ripple’s xrp price failed to find support around the 61.8% Fibonacci retracement level at $2.99 on Wednesday and declined 6.23% the next day. At the time of writing on Friday, it trades at around $2.75.
If XRP continues its correction and closes below the daily support at $2.72, it could extend the decline to the next key support at $2.35.
Like Bitcoin, XRP's momentum indicators also support the bearish view, suggesting a deeper correction ahead.
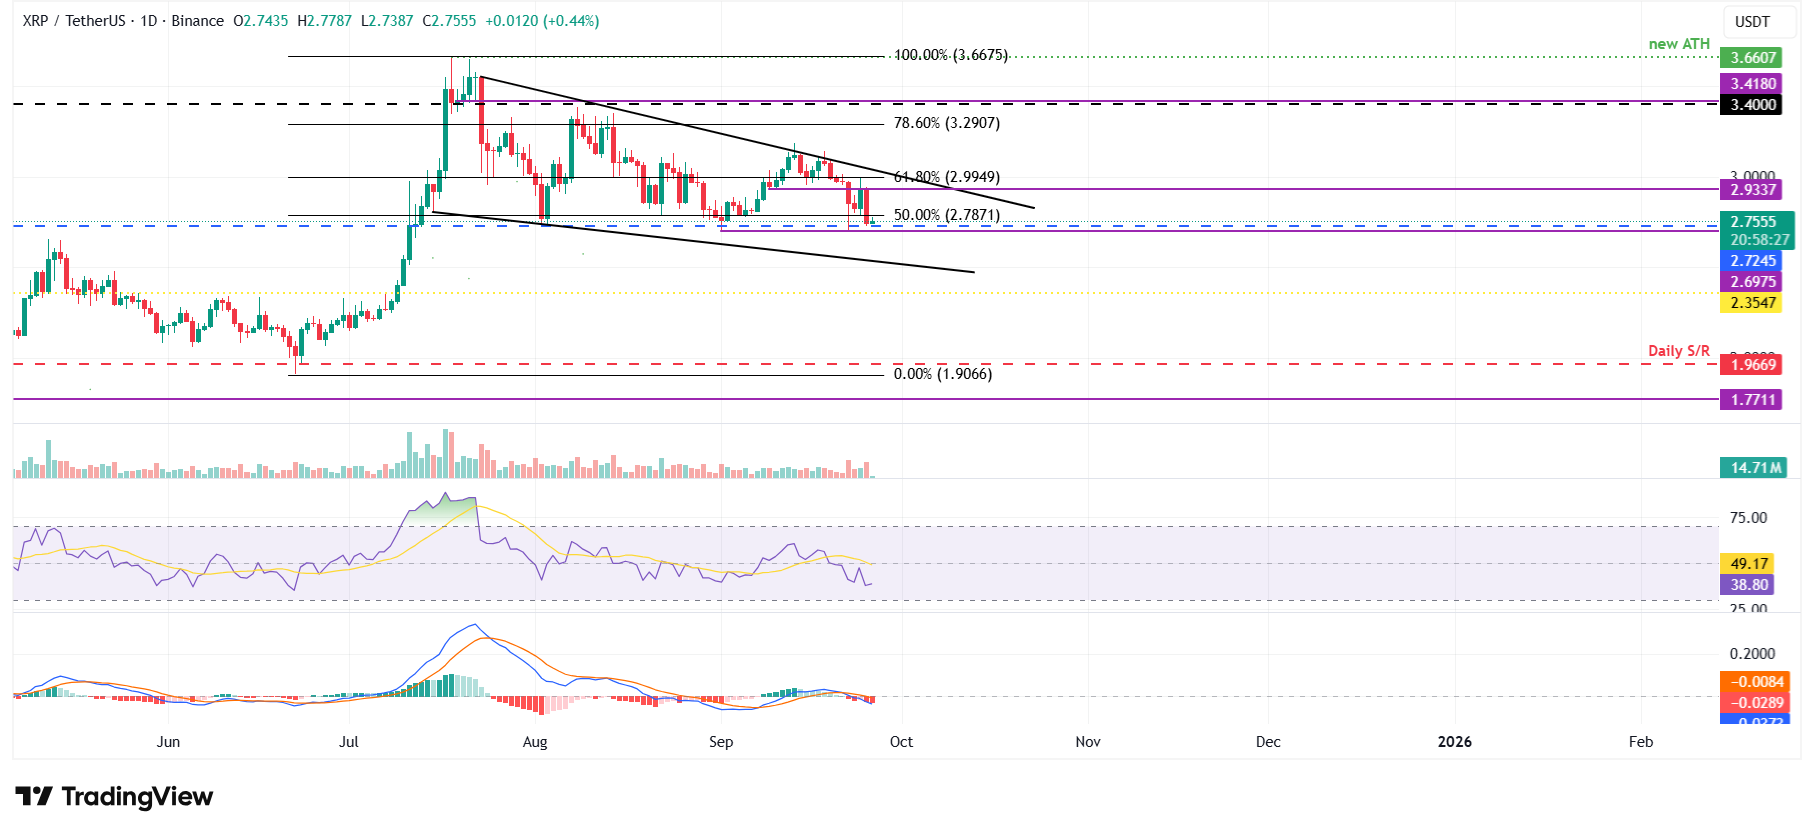
XRP/USDT daily chart
However, if XRP recovers, it could extend the recovery toward the resistance level at $2.99.
Cryptocurrency metrics FAQs
What is circulating supply?
The developer or creator of each cryptocurrency decides on the total number of tokens that can be minted or issued. Only a certain number of these assets can be minted by mining, staking or other mechanisms. This is defined by the algorithm of the underlying blockchain technology. On the other hand, circulating supply can also be decreased via actions such as burning tokens, or mistakenly sending assets to addresses of other incompatible blockchains.
What is market capitalization?
Market capitalization is the result of multiplying the circulating supply of a certain asset by the asset’s current market value.
What is trading volume?
Trading volume refers to the total number of tokens for a specific asset that has been transacted or exchanged between buyers and sellers within set trading hours, for example, 24 hours. It is used to gauge market sentiment, this metric combines all volumes on centralized exchanges and decentralized exchanges. Increasing trading volume often denotes the demand for a certain asset as more people are buying and selling the cryptocurrency.
What is the funding rate?
Funding rates are a concept designed to encourage traders to take positions and ensure perpetual contract prices match spot markets. It defines a mechanism by exchanges to ensure that future prices and index prices periodic payments regularly converge. When the funding rate is positive, the price of the perpetual contract is higher than the mark price. This means traders who are bullish and have opened long positions pay traders who are in short positions. On the other hand, a negative funding rate means perpetual prices are below the mark price, and hence traders with short positions pay traders who have opened long positions.
