Litecoin Price Forecast: LTC Stabilizes After Sharp Drop, Eyes Recovery

Litecoin finds its footing after recent turbulence—traders watch for the next move.
Technical Bounce Territory
LTC shakes off the bearish pressure that slammed prices downward. The digital silver shows resilience where weaker assets would've crumbled.
Market Psychology at Play
Fear-driven selling exhausts itself—creating prime conditions for contrarian buyers. Litecoin's established network effect provides fundamental support that meme coins can only dream about.
Recovery Signals Emerging
Volume patterns suggest accumulation happening beneath the surface. Smart money positions while retail investors panic-sell based on headlines.
Litecoin's proving yet again that volatility cuts both ways—sometimes the best opportunities emerge when traditional finance pundits are busy writing crypto's obituary.
LTC whale bought the recent price dips
Santiment’s Supply Distribution data supports a bullish outlook for Litecoin. The metric indicates that whales holding between 100,000 and 1 million LTC tokens (red line) have accumulated 660,000 tokens since September 20. During the same period, wallets holding between 1 million and 10 million LTC tokens (yellow line) have shed 580,000 tokens.
This shows that the second cohort of whales could have fallen prey to the capitulation event. In contrast, the first set of wallets seized the opportunity and accumulated Litecoin at a discount.
%20%5B12-1758701284138-1758701284140.52.29,%2024%20Sep,%202025%5D.png)
LTC supply distribution metric chart. Source: Santiment
Examining Santiments’ Age Consumed index also shows bullish signs. The spikes in this index suggest dormant tokens (tokens stored in wallets for a long time) are in motion, and it can be used to spot short-term local tops or bottoms.
As in the case of Litecoin, history shows that a rally followed the spikes in LTC’s price as holders moved tokens from exchanges to wallets, thereby decreasing the selling pressure. The most recent uptick on Wednesday forecasts that LTC is ready for an uptrend.
%20%5B11-1758701320726-1758701320727.02.05,%2024%20Sep,%202025%5D.png)
LTC Age Consumed index chart. Source: Santiment
Litecoin Price Forecast: LTC could rebound if the support zone holds
Litecoin price faced rejection at the start of this week and declined over 7% on Monday, closing below the 61.8% Fibonacci retracement level at $107.09 (drawn from the April low of $63.08 to the August high of $134.29). However, LTC recovered slightly on Tuesday after retesting the 200-day Exponential Moving Average (EMA) at $103.24.
The 200-day EMA roughly coincides with other key levels, making this a significant support zone for a key reversal.
At the time of writing on Wednesday, LTC continues to recover, trading around $106.
If LTC continues to hold above the above-mentioned support zone, it could extend the rally toward the next resistance at $130.
However, the Relative Strength on the daily chart reads 39, indicating that the bears are still in control of the momentum. For the recovery rally to be sustained, the RSI must MOVE above the neutral level of 50.
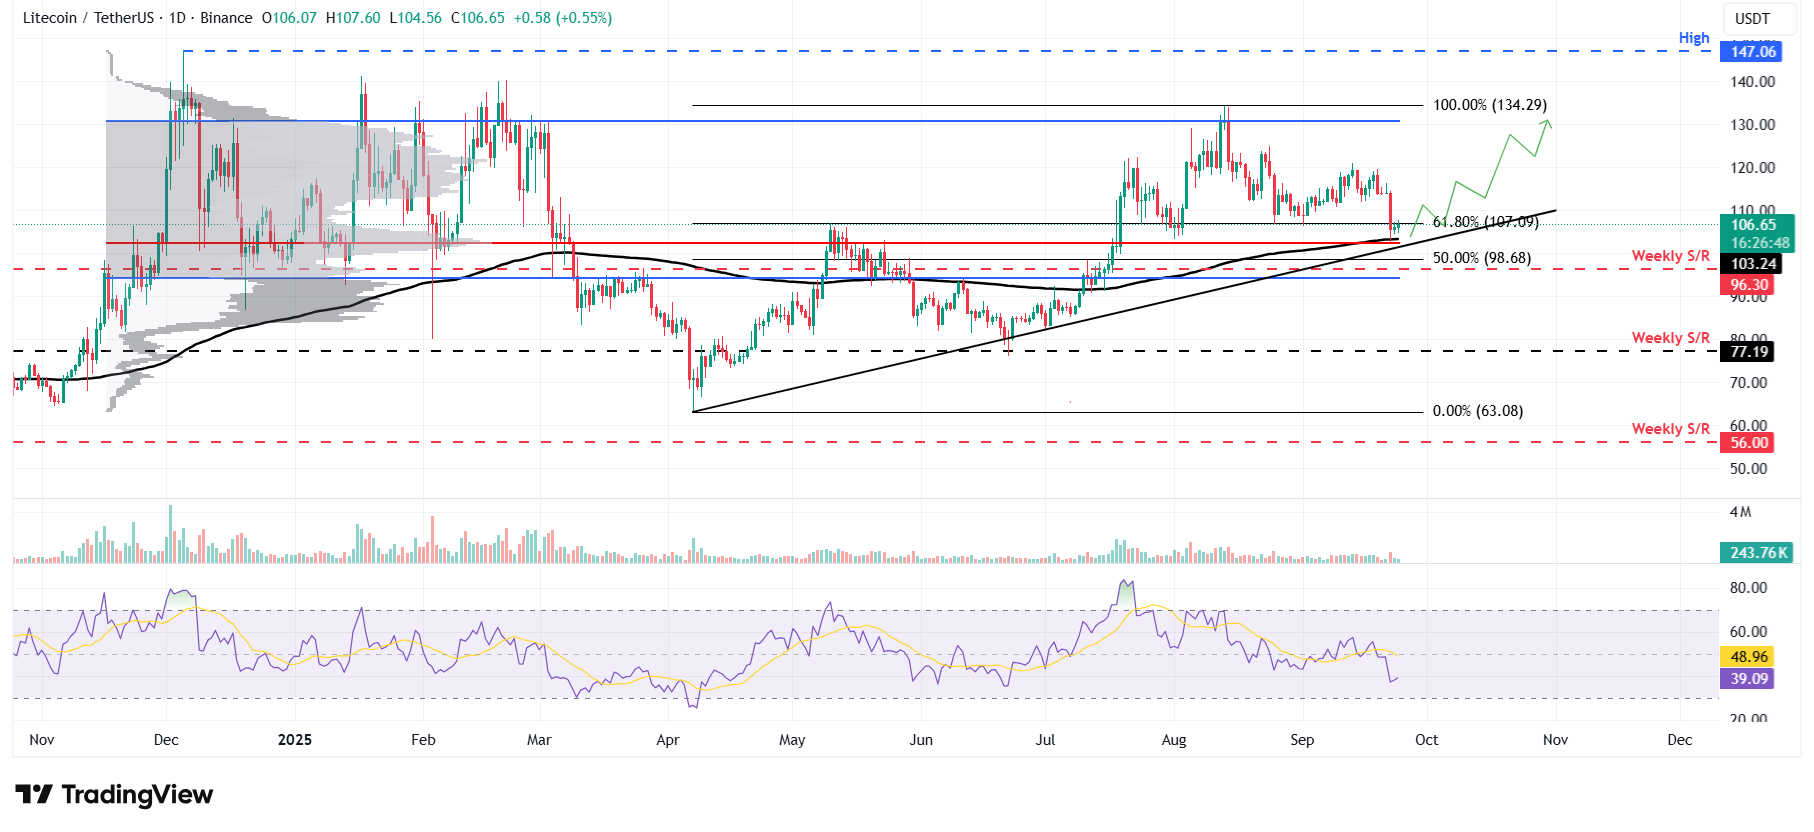
LTC/USDT daily chart
However, if LTC corrects and closes below the 50% Fibonacci retracement level at $98.68, it could extend the decline toward the weekly support level at $96.30.
