Bitcoin Cash Price Forecast: Why Declining Open Interest and Whale Holdings Signal Growing Downside Risk

Bitcoin Cash faces mounting pressure as key metrics flash warning signs—just when traders thought the worst was over.
Market Metrics Turn Bearish
Open interest tanks while whale accumulation slows to a crawl. The smart money's pulling back, leaving retail holders holding the bag—again.
Liquidity Evaporates
Fewer big players means thinner order books. Any significant sell-off could trigger cascading liquidations in this fragile environment.
Technical Breakdown Looms
Without whale support, critical support levels become vulnerable. The charts don't lie—momentum's shifting toward the bears.
Meanwhile, traditional finance bros still think 'blockchain' is a new type of yoga pose. Some things never change.
Derivatives and on-chain data indicate downside risk persists
Santiment data shows a drift developing between retail and large wallet investors based on the Bitcoin Cash supply distribution. Investors with less than 10,000 BCH continue the accumulation spree, reaching a total holding of 11.27 million BCH.
On the other hand, large investors with 10,000 to 1 million tokens have trimmed their holdings to 8.71 million BCH, from the year-to-date high of 9 million BCH on April 9. Typically, the trading activity of whales is a trend-deciding factor, which in this case could result in heightened selling pressure.
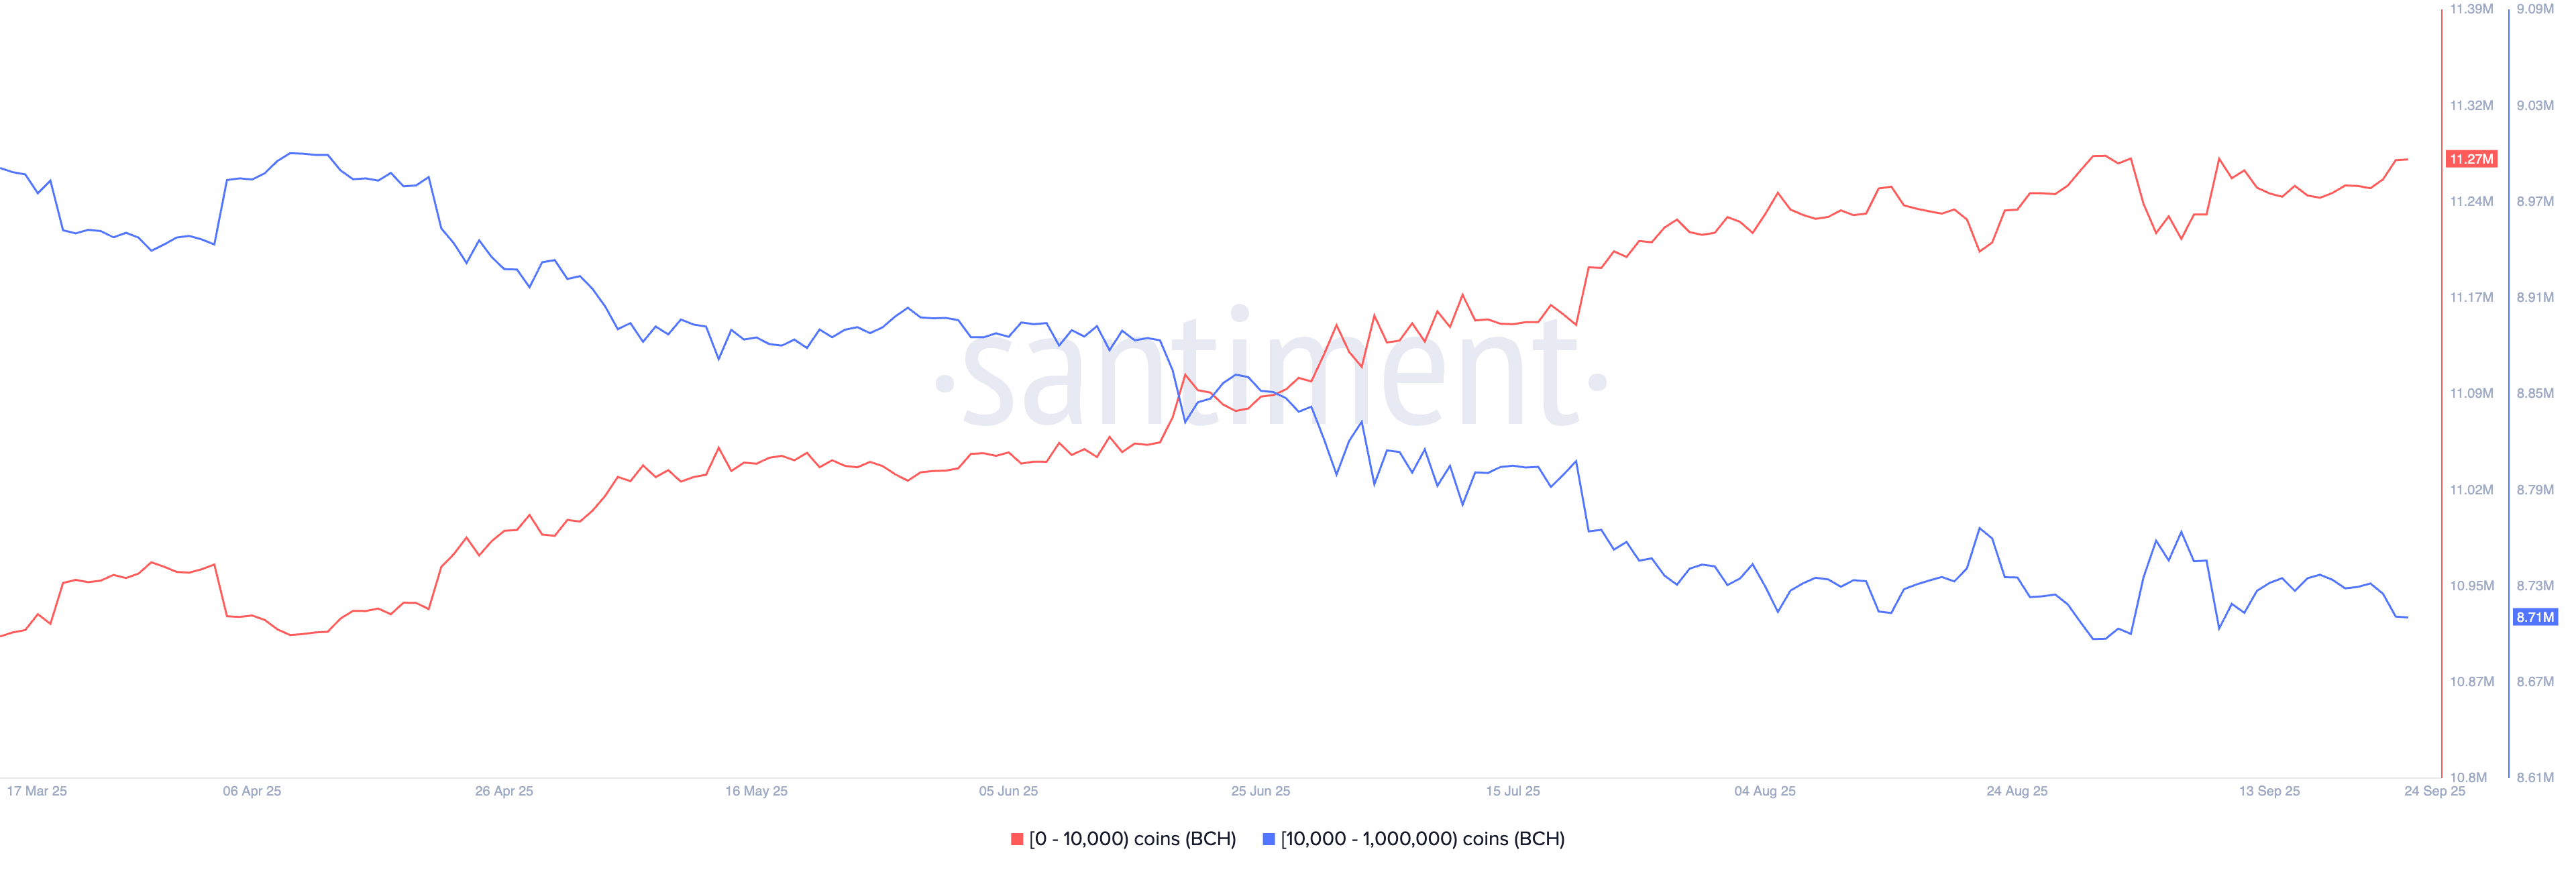
Bitcoin Cash supply distribution. Source: Santiment
Adding to the downside, CoinGlass data reveals that the Bitcoin Cash Open Interest (OI) has declined by 2.16% in the last 24 hours, reaching $432.79 million. This significant capital outflow from BCH derivatives suggests that traders are exiting either due to forced liquidation or a decline in confidence.
The 24-hour liquidation data shows a bearish incline as long liquidations at $313,580 outpace the short liquidations of $33,450. This indicates that a greater number of bullish-aligned positions were wiped out in the last 24 hours.
Finally, the OI-weighted funding rate has decreased to 0.0019% at press time on Wednesday, from the intraday peak of 0.0071%, indicating a decline in bullish trading activity.
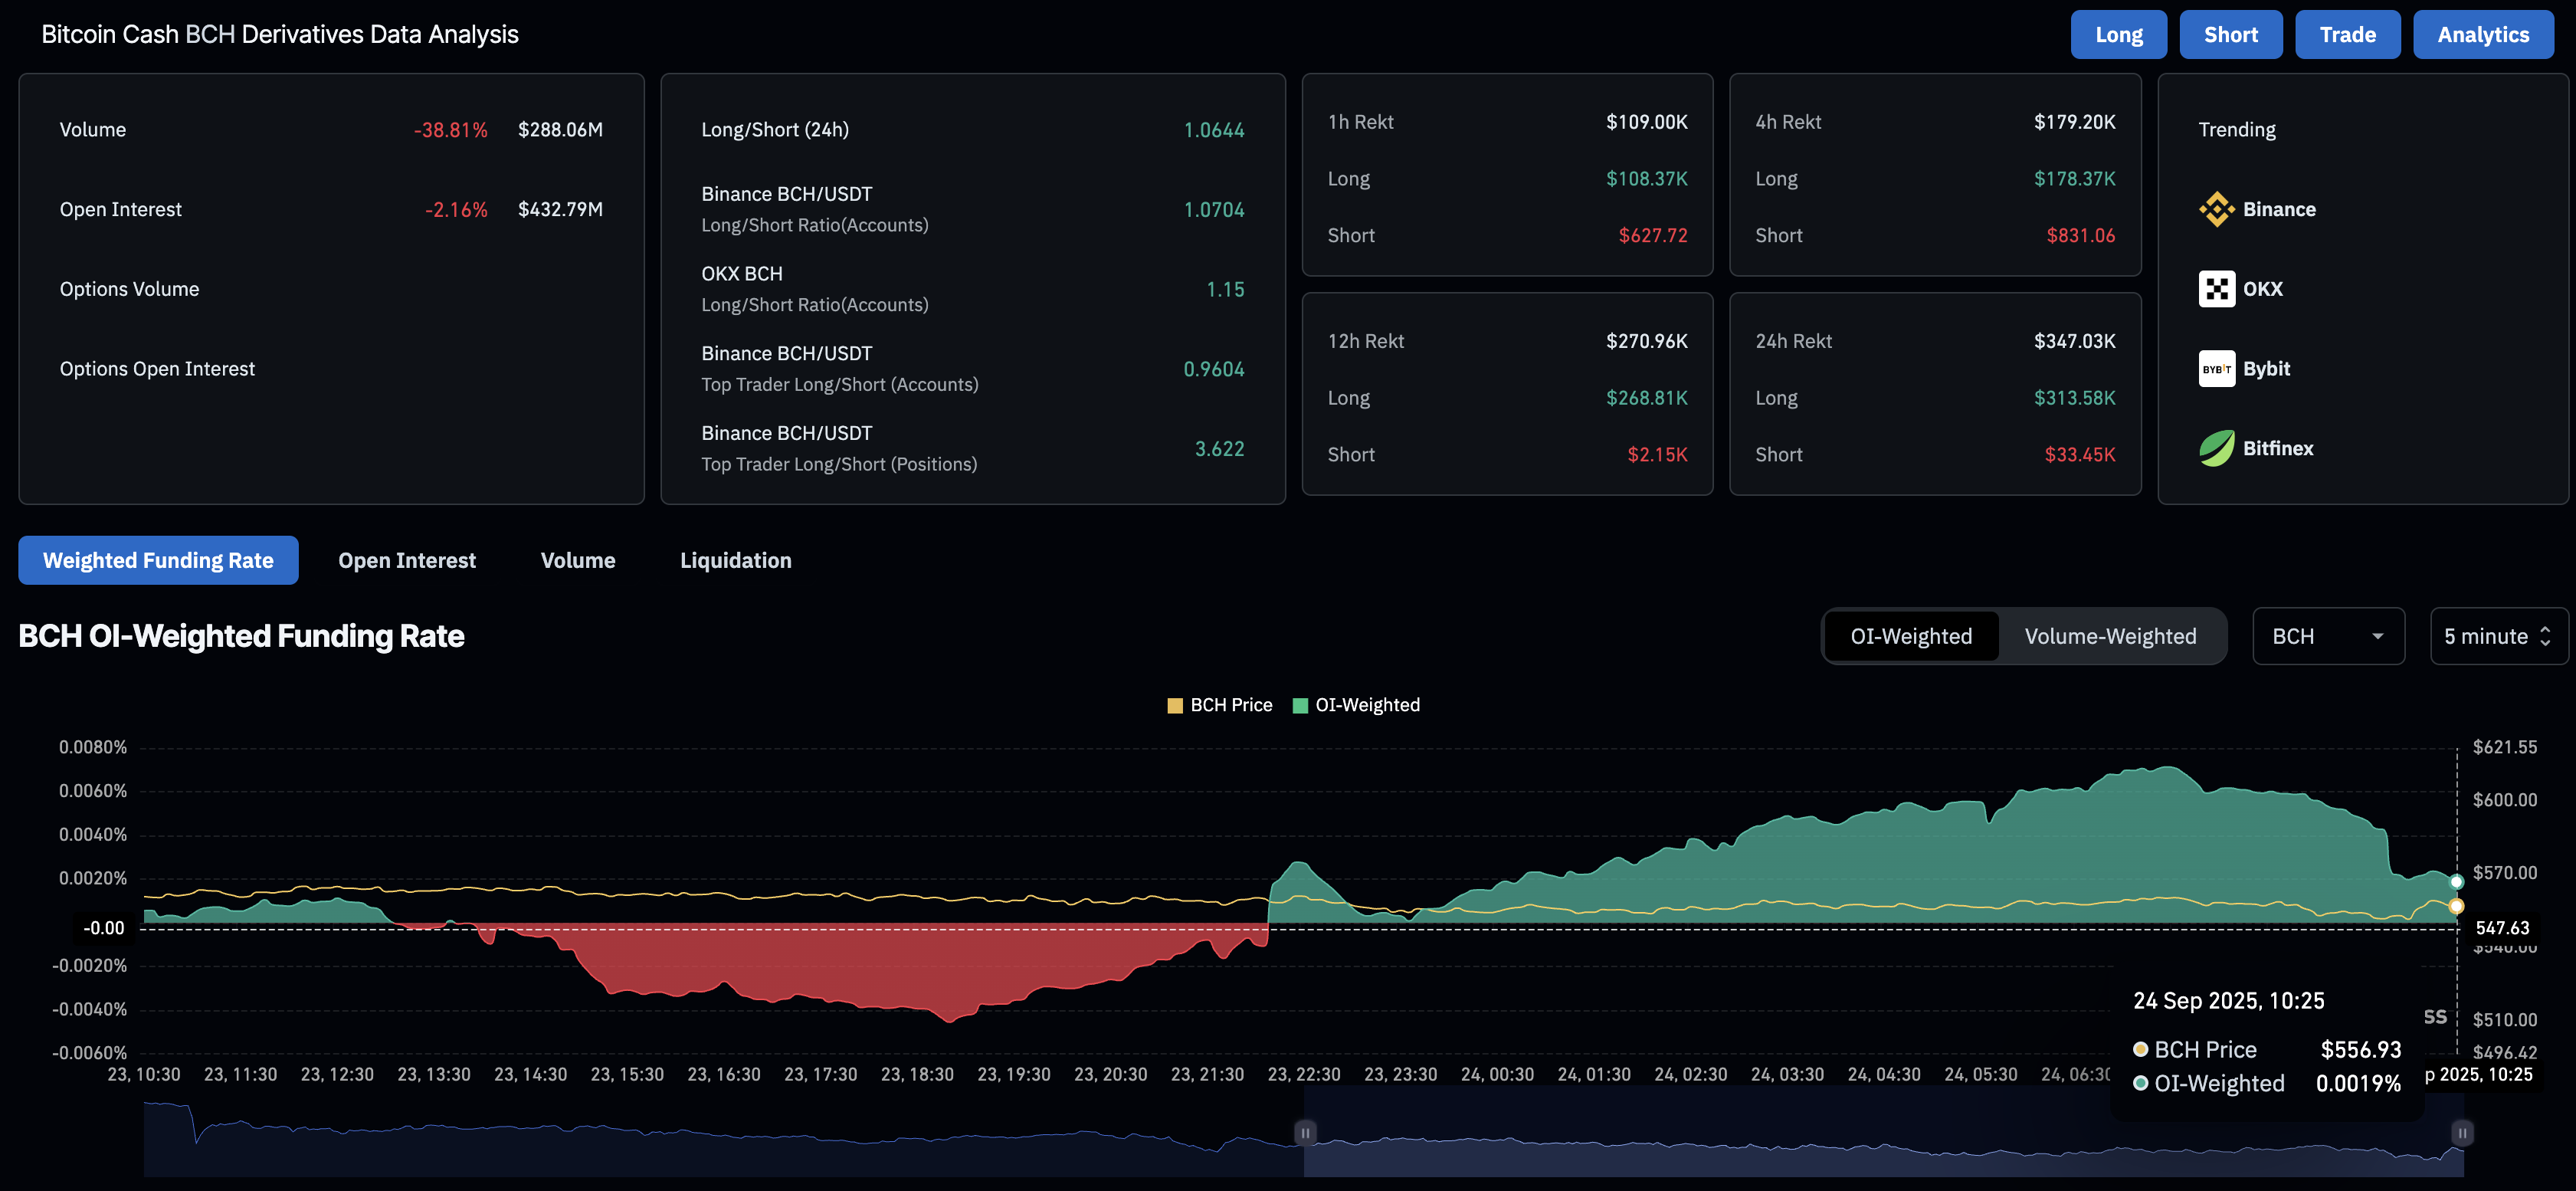
Bitcoin Cash derivatives. Source: CoinGlass
Bitcoin Cash risks losing the $500 milestone
Bitcoin Cash holds above the 100-period Exponential Moving Average (EMA) at $541, rising after five days of downtrend and breaking down an expanding channel on the daily chart. Despite the short-term rise, momentum indicators on the same chart reflect that the bearish momentum remains prominent.
The Relative Strength Index (RSI) at 42 remains below the midpoint, indicating further room for correction. Additionally, the Moving Average Convergence Divergence (MACD) indicator hits the zero line after crossing below its signal line on Sunday. A successive rise in the red histogram bars indicates increasing bearish momentum.
If BCH marks a decisive close below the 100-day EMA at $541, it could extend the decline to the 200-day EMA at $493.
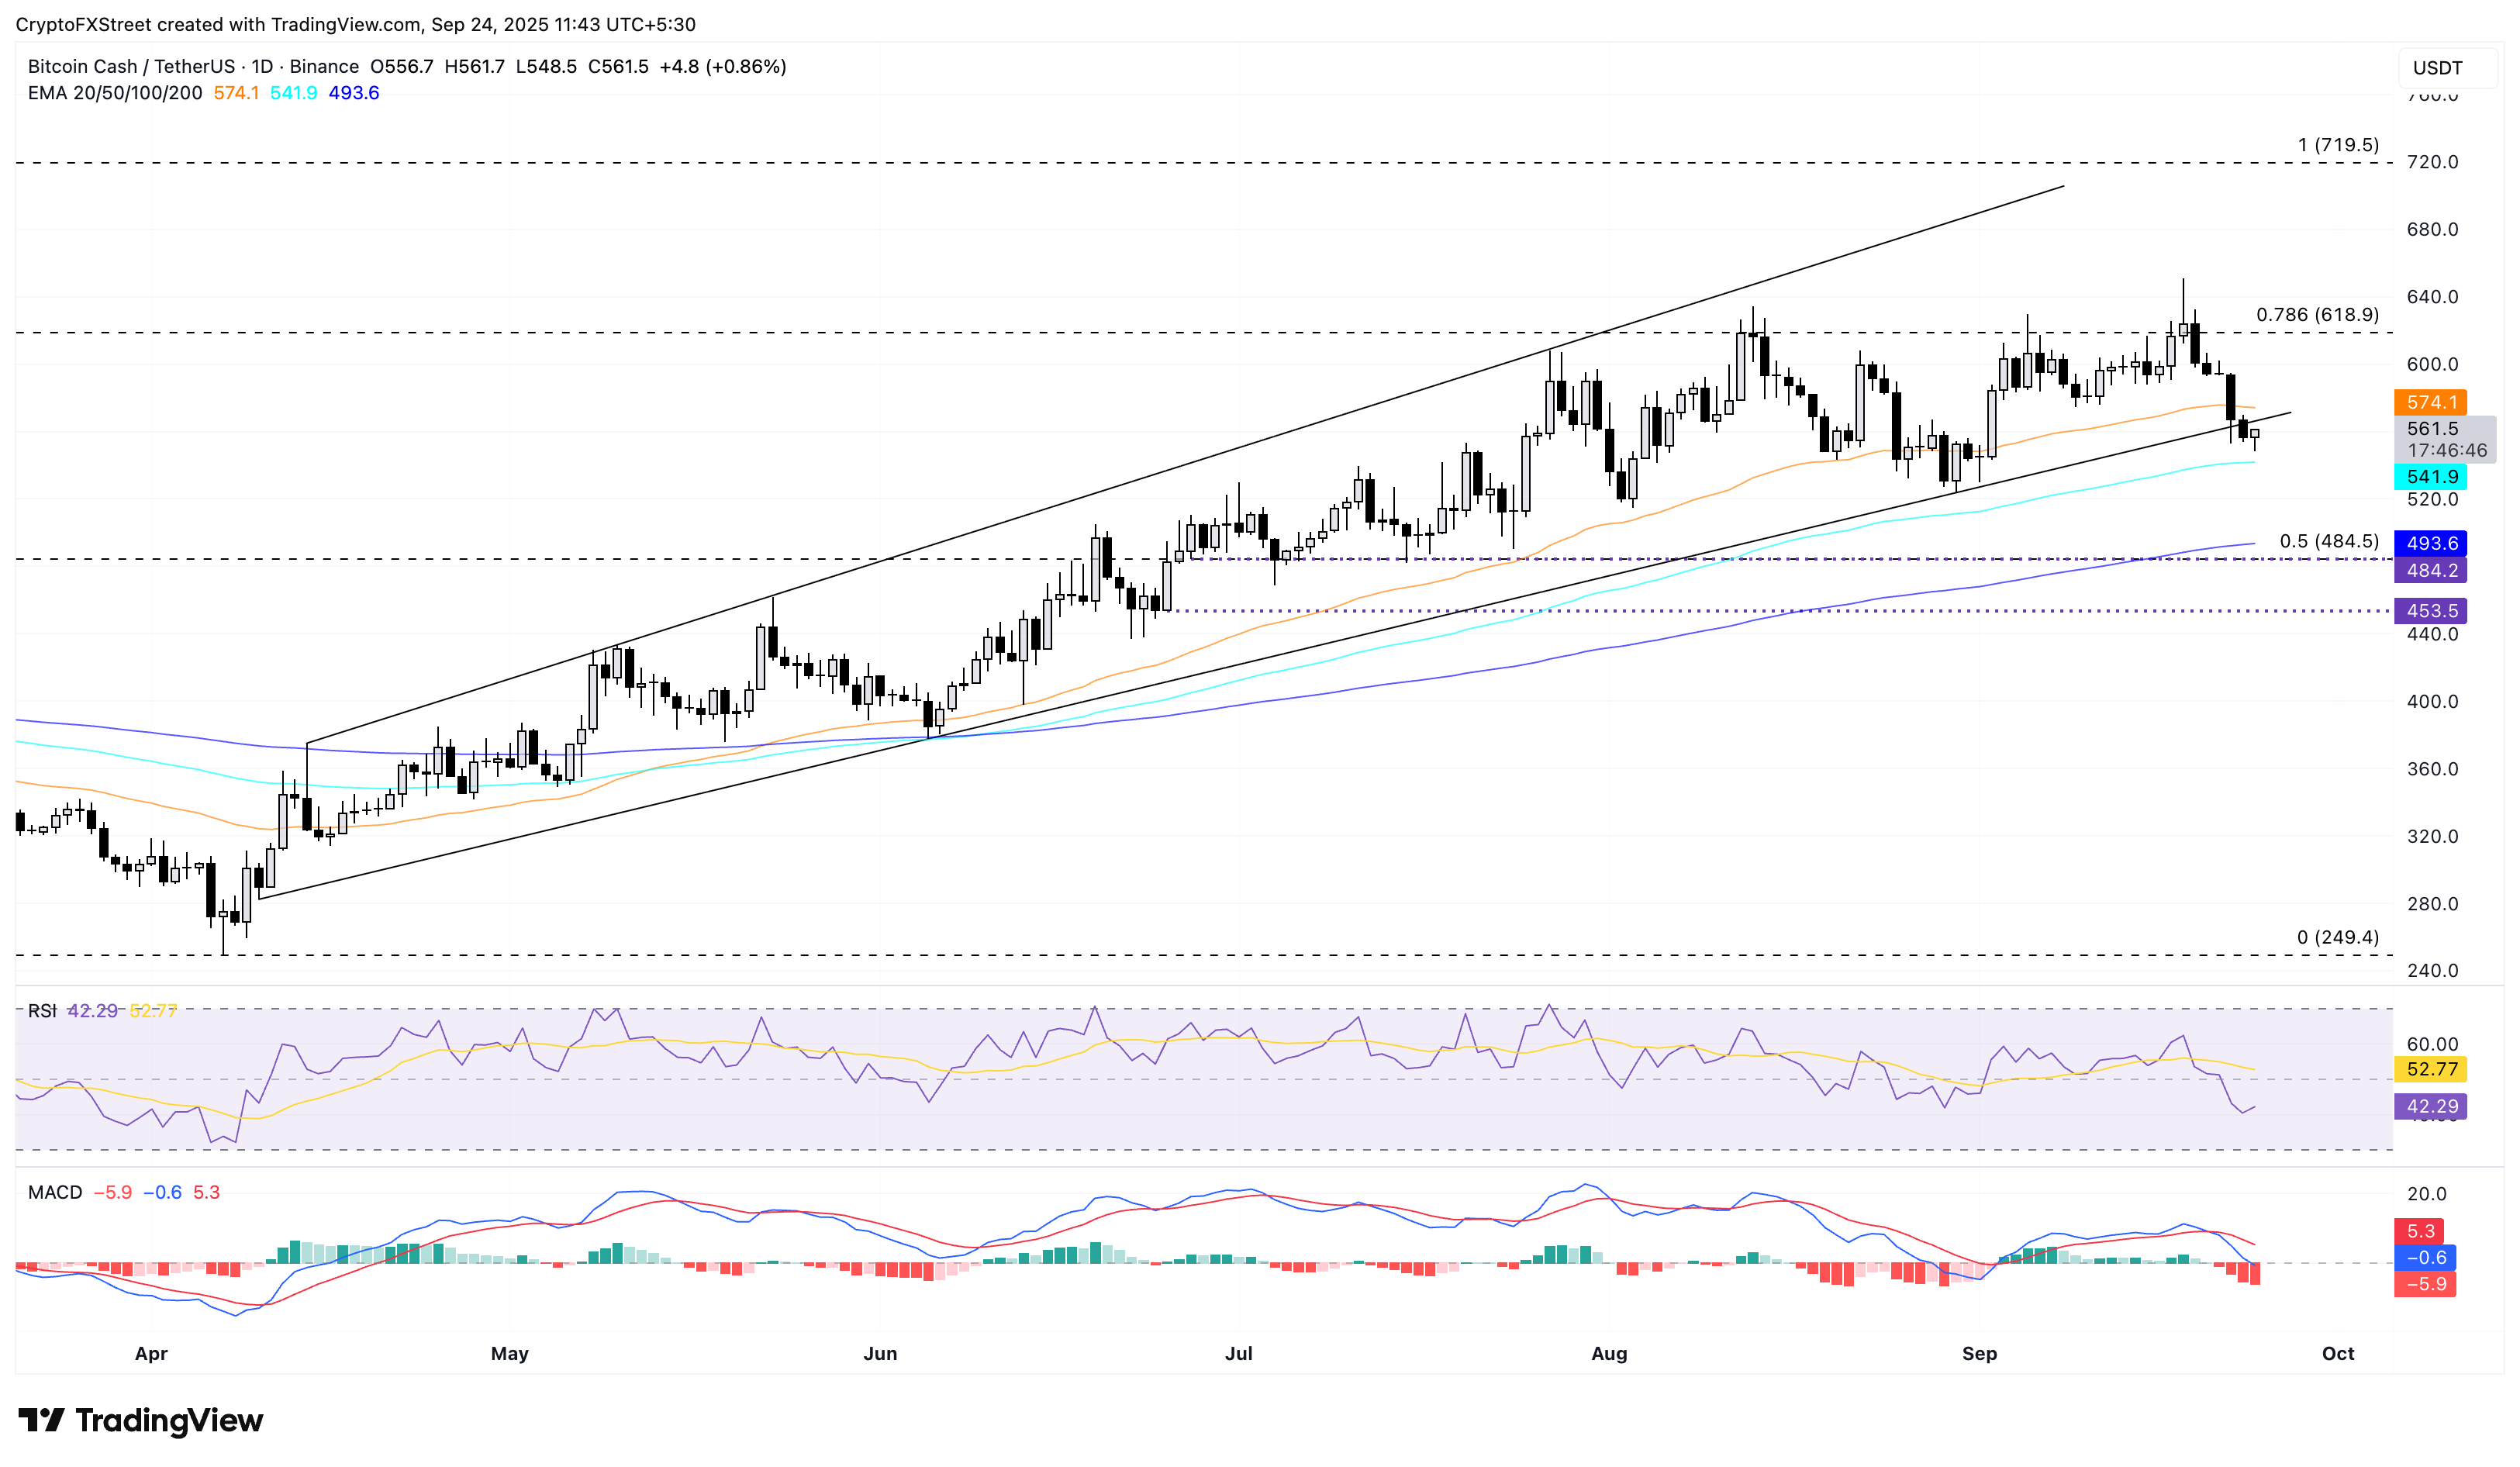
BCH/USDT daily price chart.
On the contrary, a potential extended recovery should reclaim the 50-day EMA at $574 to invalidate the breakdown of the channel pattern. In this case, a rebound to the 78.6% Fibonacci retracement level at $618 WOULD be possible, retracing from the $640 high on December 6 to the $249 low on April 7.
