Analyst Reveals Bitcoin’s ’Supercycle’ Pattern Targets $150K Milestone

Bitcoin's chart flashes a rare supercycle signal—and one analyst says it's pointing straight toward $150,000.
The Setup
Historical patterns suggest Bitcoin isn’t just rallying—it’s entering a phase of accelerated, structural growth. Past cycles saw 5x runs; this one’s playing bigger.
Why $150K Isn’t Crazy
Institutional inflows, shrinking supply, and macro tremors keep fueling the fire. Traditional finance still thinks it’s a bubble—right up until they FOMO in.
Timing the Wave
Supercycles don’t wait for permission. They rip when sentiment’s split and skeptics are loudest. Sound familiar?
Wake-Up Call to Wall Street
While analysts downgrade equities and debate inflation, Bitcoin’s quietly scripting a wealth transfer—no permission needed.
Double Inverse Head and Shoulders Formation
Crypto analyst Merlijn The Trader has identified what he calls a “supercycle formation” on Bitcoin’s long-term chart. He pointed to two inverse head and shoulders patterns, a setup often linked to major bullish reversals.
THE INVERSE HEAD & SHOULDERS OF DREAMS
Left shoulder. Head. Right shoulder.
Not one but two.
It’s the supercycle formation.
This is the setup of a generation. Don’t fade it.$BTC to $150K. Locked in. pic.twitter.com/imyHqJKjkC
— Merlijn The Trader (@MerlijnTrader) September 4, 2025
The first pattern stretches from 2021 to 2024, with the left shoulder during the 2021–2022 peak and correction, the head at the 2022 low NEAR $15,000, and the right shoulder during the 2023–2024 recovery. A second, smaller inverse head and shoulders has formed in the $70,000–$95,000 range in 2025. Merlijn said:
“This is the setup of a generation. Don’t fade it. $BTC to $150K. Locked in.”
Notably, the neckline of the smaller pattern is near $95,000. As long as the price holds above it, the projection is for a run toward $150,000. Bitcoin is currently trading around $111,000, with consolidation seen in the $110,000–$115,000 zone.
Resistance and Short-Term Pressure
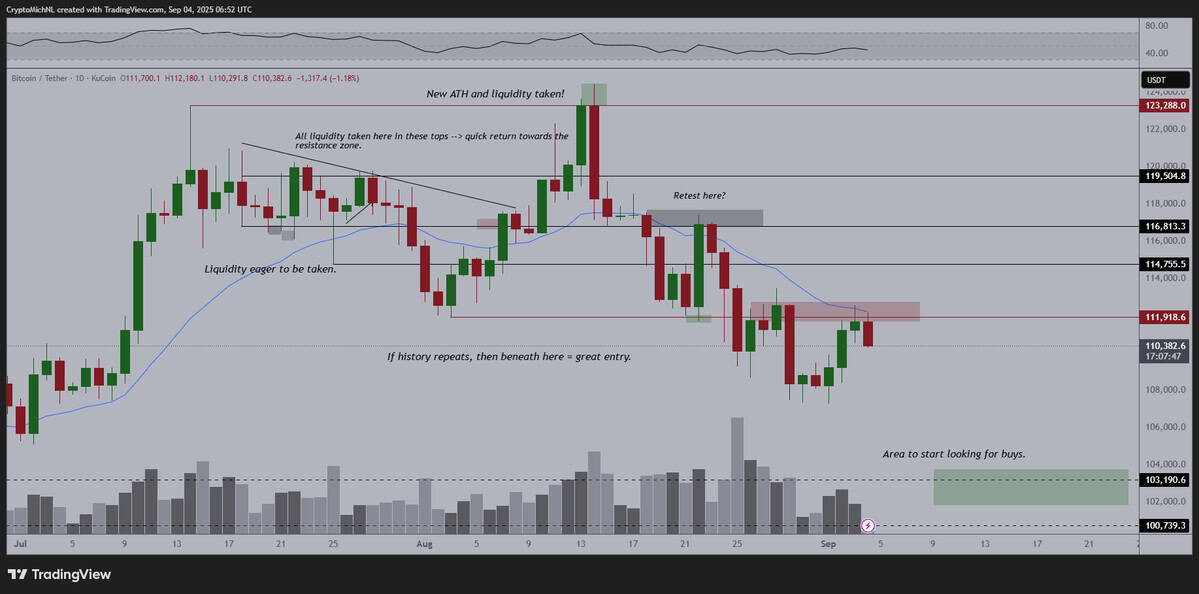
Michaël van de Poppe offered a shorter-term view, pointing to resistance at $111,918, which also lines up with the 20-week EMA. bitcoin has struggled to close above this level.
He commented:
“Resistance remains resistance, couldn’t break through it, similarly for the 20-Week EMA. If this isn’t breaking through, I WOULD project we’re making a new low and that’s where you need to go max long #Altcoins.”
If resistance holds, charts show a possible drop toward $103,000–$101,000, an area marked as a potential re-entry point for buyers.
Cycle Outlook Into 2025
Analyst Ted compared Bitcoin’s market action with the Wall Street Cheat Sheet cycle. He sees September 2025 as a period of sideways or bearish action, followed by a strong Q4 rally.
According to his outlook, a blow-off top could arrive in December 2025 or January 2026, echoing past cycle peaks. He said:
“September could be bearish or sideways, followed by a massive rally in Q4. The blow-off top will be in Dec 2025 or Jan 2026, just like the past cycles.”
Afterward, he expects a sharp correction into early 2026.
At the same time, Bitcoin adoption is strengthening. Analyst Lucky noted that businesses are now allocating around 22% of profits into Bitcoin. He also reported that institutions have added $43.5 billion worth of Bitcoin to balance sheets in 2025 alone.
He wrote:
“With thousands of businesses buying Bitcoin daily, it shows no signs of slowing down.”
This trend adds a fundamental LAYER of support alongside technical projections, with institutional and corporate demand reinforcing long-term growth expectations.
