Bitcoin Price Analysis: Will BTC Crash Below $100K if This Critical Support Level Fails?

Bitcoin teeters on the edge as key support threatens to give way—sending shockwaves through crypto markets.
The $100K Question
All eyes are on Bitcoin's crucial support level after recent volatility shook investor confidence. A break below this threshold could trigger cascading liquidations—potentially pushing prices toward that psychological $100,000 barrier faster than a hedge fund dumping tokens after a minor tweet.
Market Mechanics at Play
Technical indicators suggest mounting pressure as institutional flows slow and retail sentiment wobbles. The usual 'buy the dip' crowd seems hesitant—maybe they're too busy recalculating their lambo timelines.
Broader Implications
A sustained breakdown wouldn't just hurt BTC holders. Altcoins would likely get dragged down too—proving once again that when Bitcoin sneezes, the entire crypto market catches a cold (and probably liquidates their leverage positions).
Regulatory Shadow Boxing
Meanwhile, regulators continue their delicate dance of pretending to understand decentralized tech while drafting legislation that'll be outdated before the ink dries. Classic FSA move—always closing the barn door after the digital horses have bolted.
Volatility Ahead
One thing's certain: whether holding or folding, traders face white-knuckle action ahead. Because in crypto, the only thing more predictable than volatility is Wall Street's sudden 'discovery' of blockchain every time their traditional portfolios underperform.
Technical Analysis
By Shayan
The Daily Chart
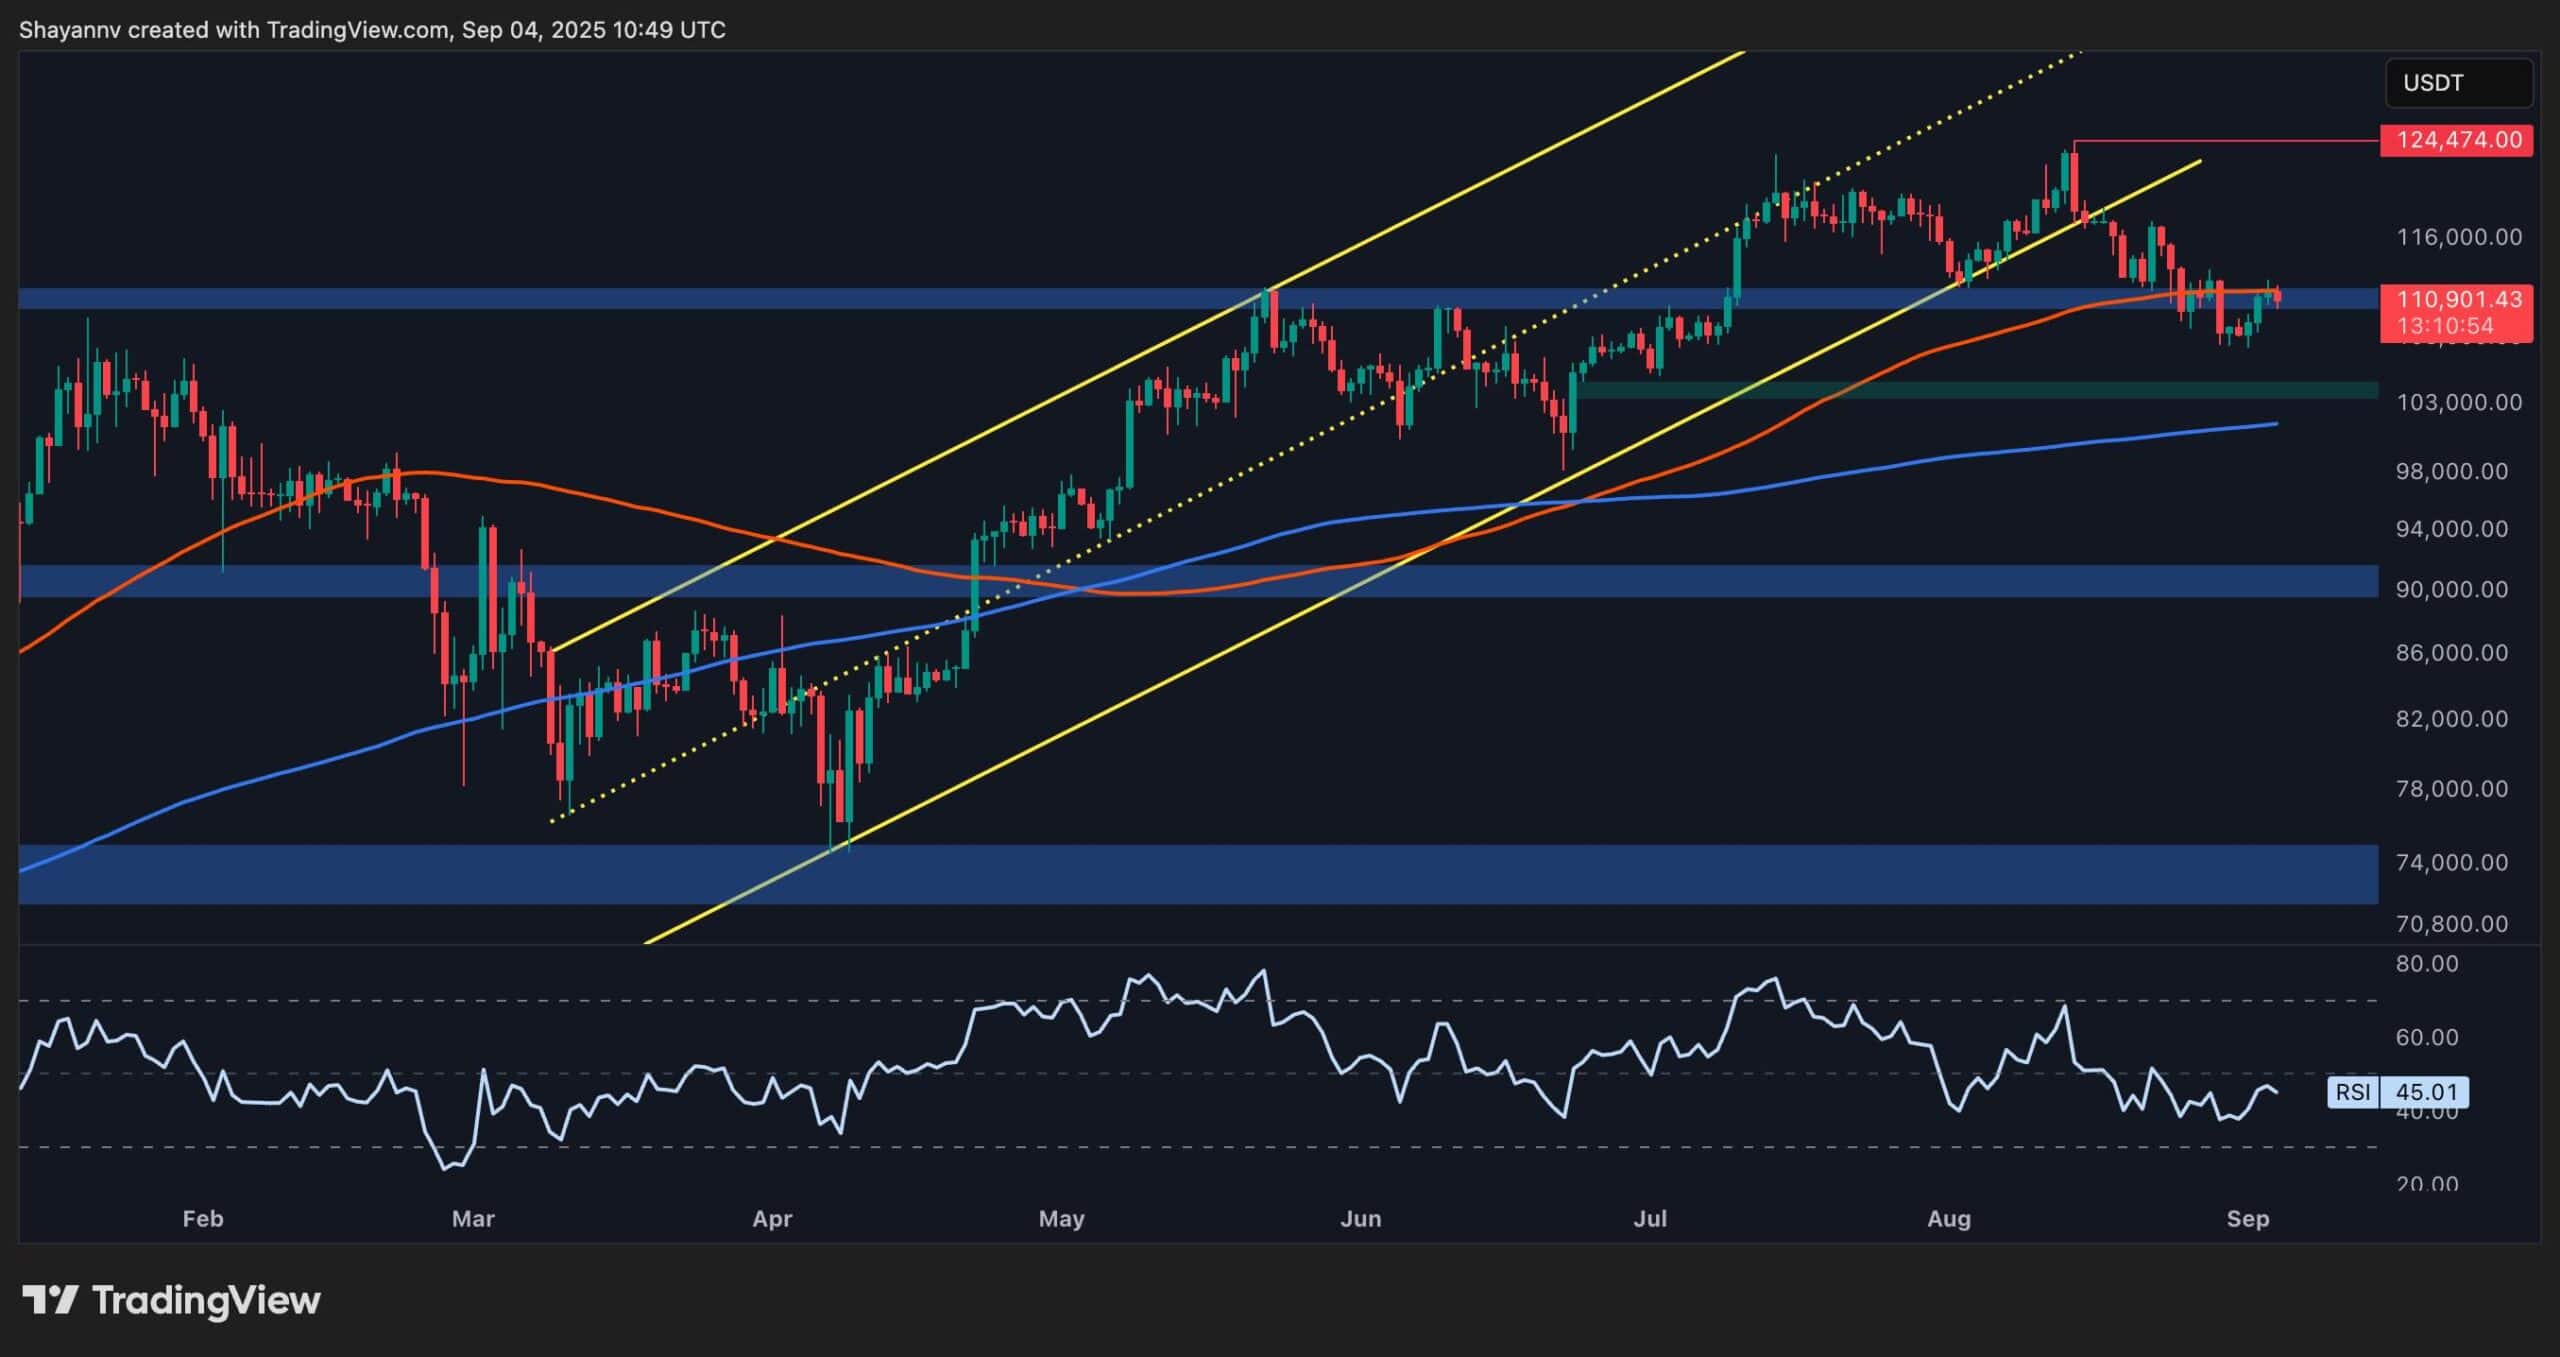
On the daily chart, BTC has broken down from its ascending channel and is currently testing the $110K level from below, after slumping below it last week. The breakdown from the channel and failure to reclaim higher levels shows a loss of momentum after months of steady gains. The RSI remains weak NEAR 45, reflecting subdued buying pressure and indecision among market participants.
The 100-day moving average is also nearby, aligning with the $110K zone, making this level a critical battleground. If buyers fail to reclaim this range, the next support lies around $104K. On the other hand, reclaiming $110K WOULD signal renewed bullish strength, potentially opening the door to retest the $124K all-time high.
The 4-Hour Chart
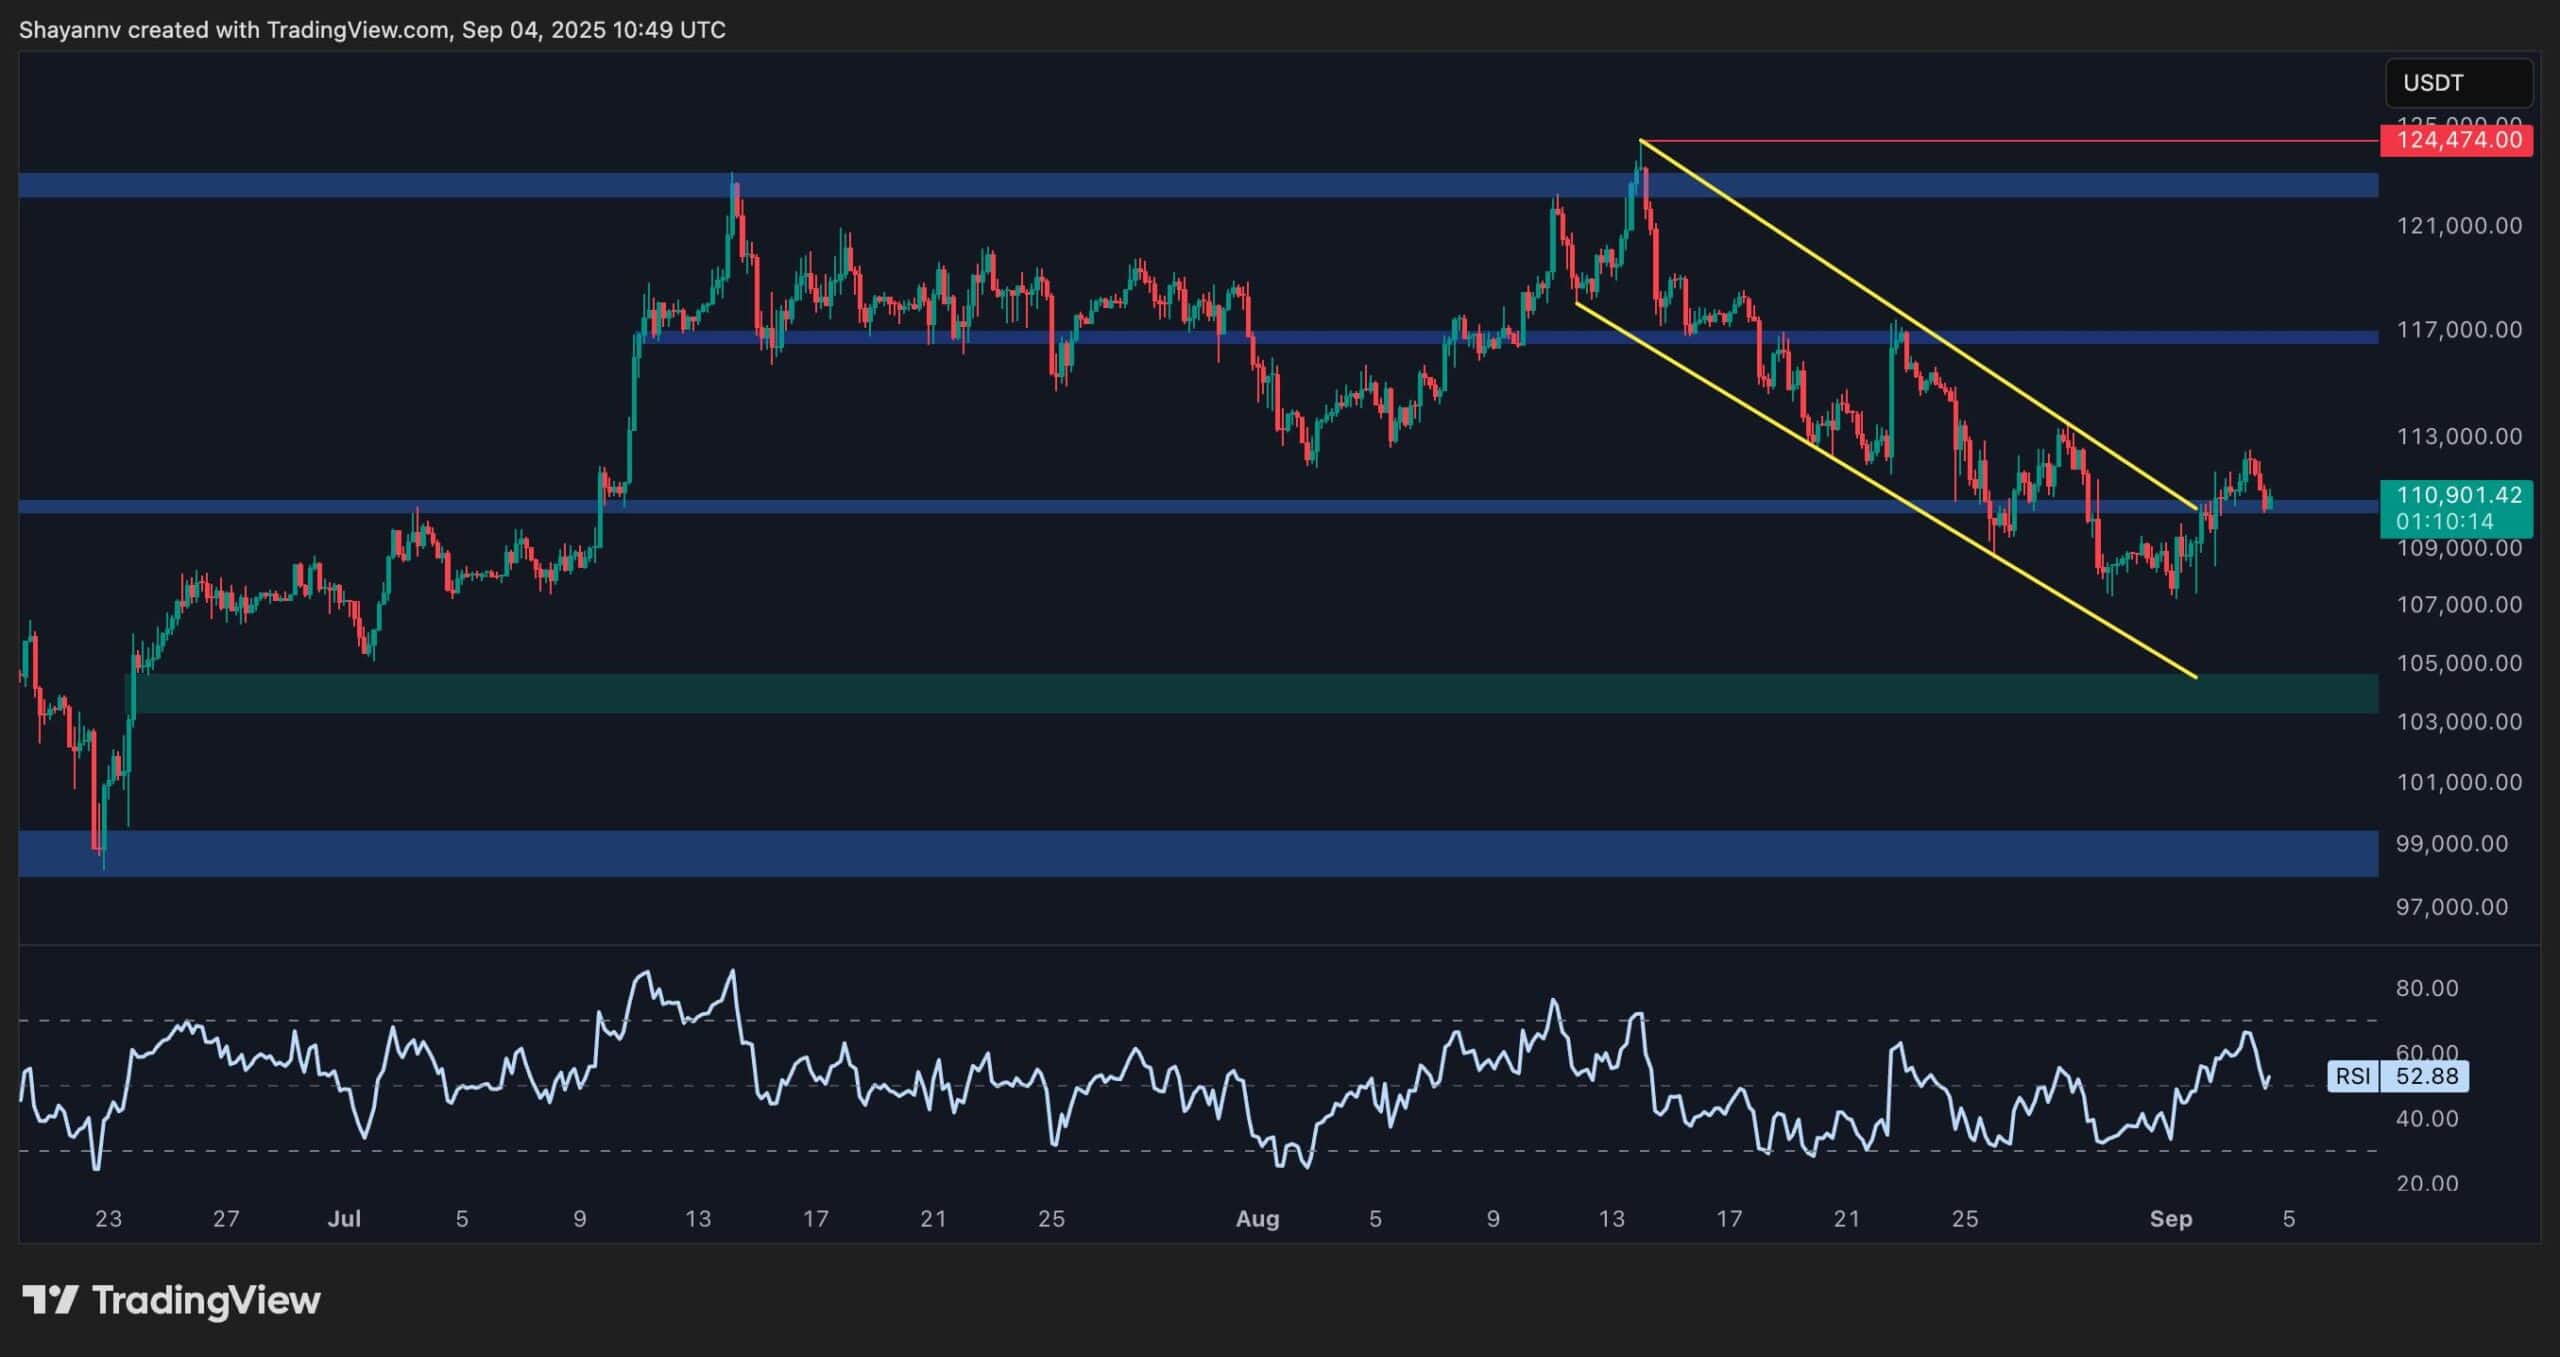
On the 4-hour chart, Bitcoin recently broke out of a descending channel, showing that short-term selling pressure has eased. It was followed by a rejection at the $113K level, sending the price back toward the $110K–$109K support band. The RSI is hovering slightly above 50, suggesting a neutral bias with room for either continuation higher or renewed weakness.
As long as the $110K level holds, bulls may attempt another push toward the $113K and $117K highs. However, a decisive drop below $110K would likely invite sellers back in, with the $104K fair value gap as the next logical target.
Sentiment Analysis
Funding Rates
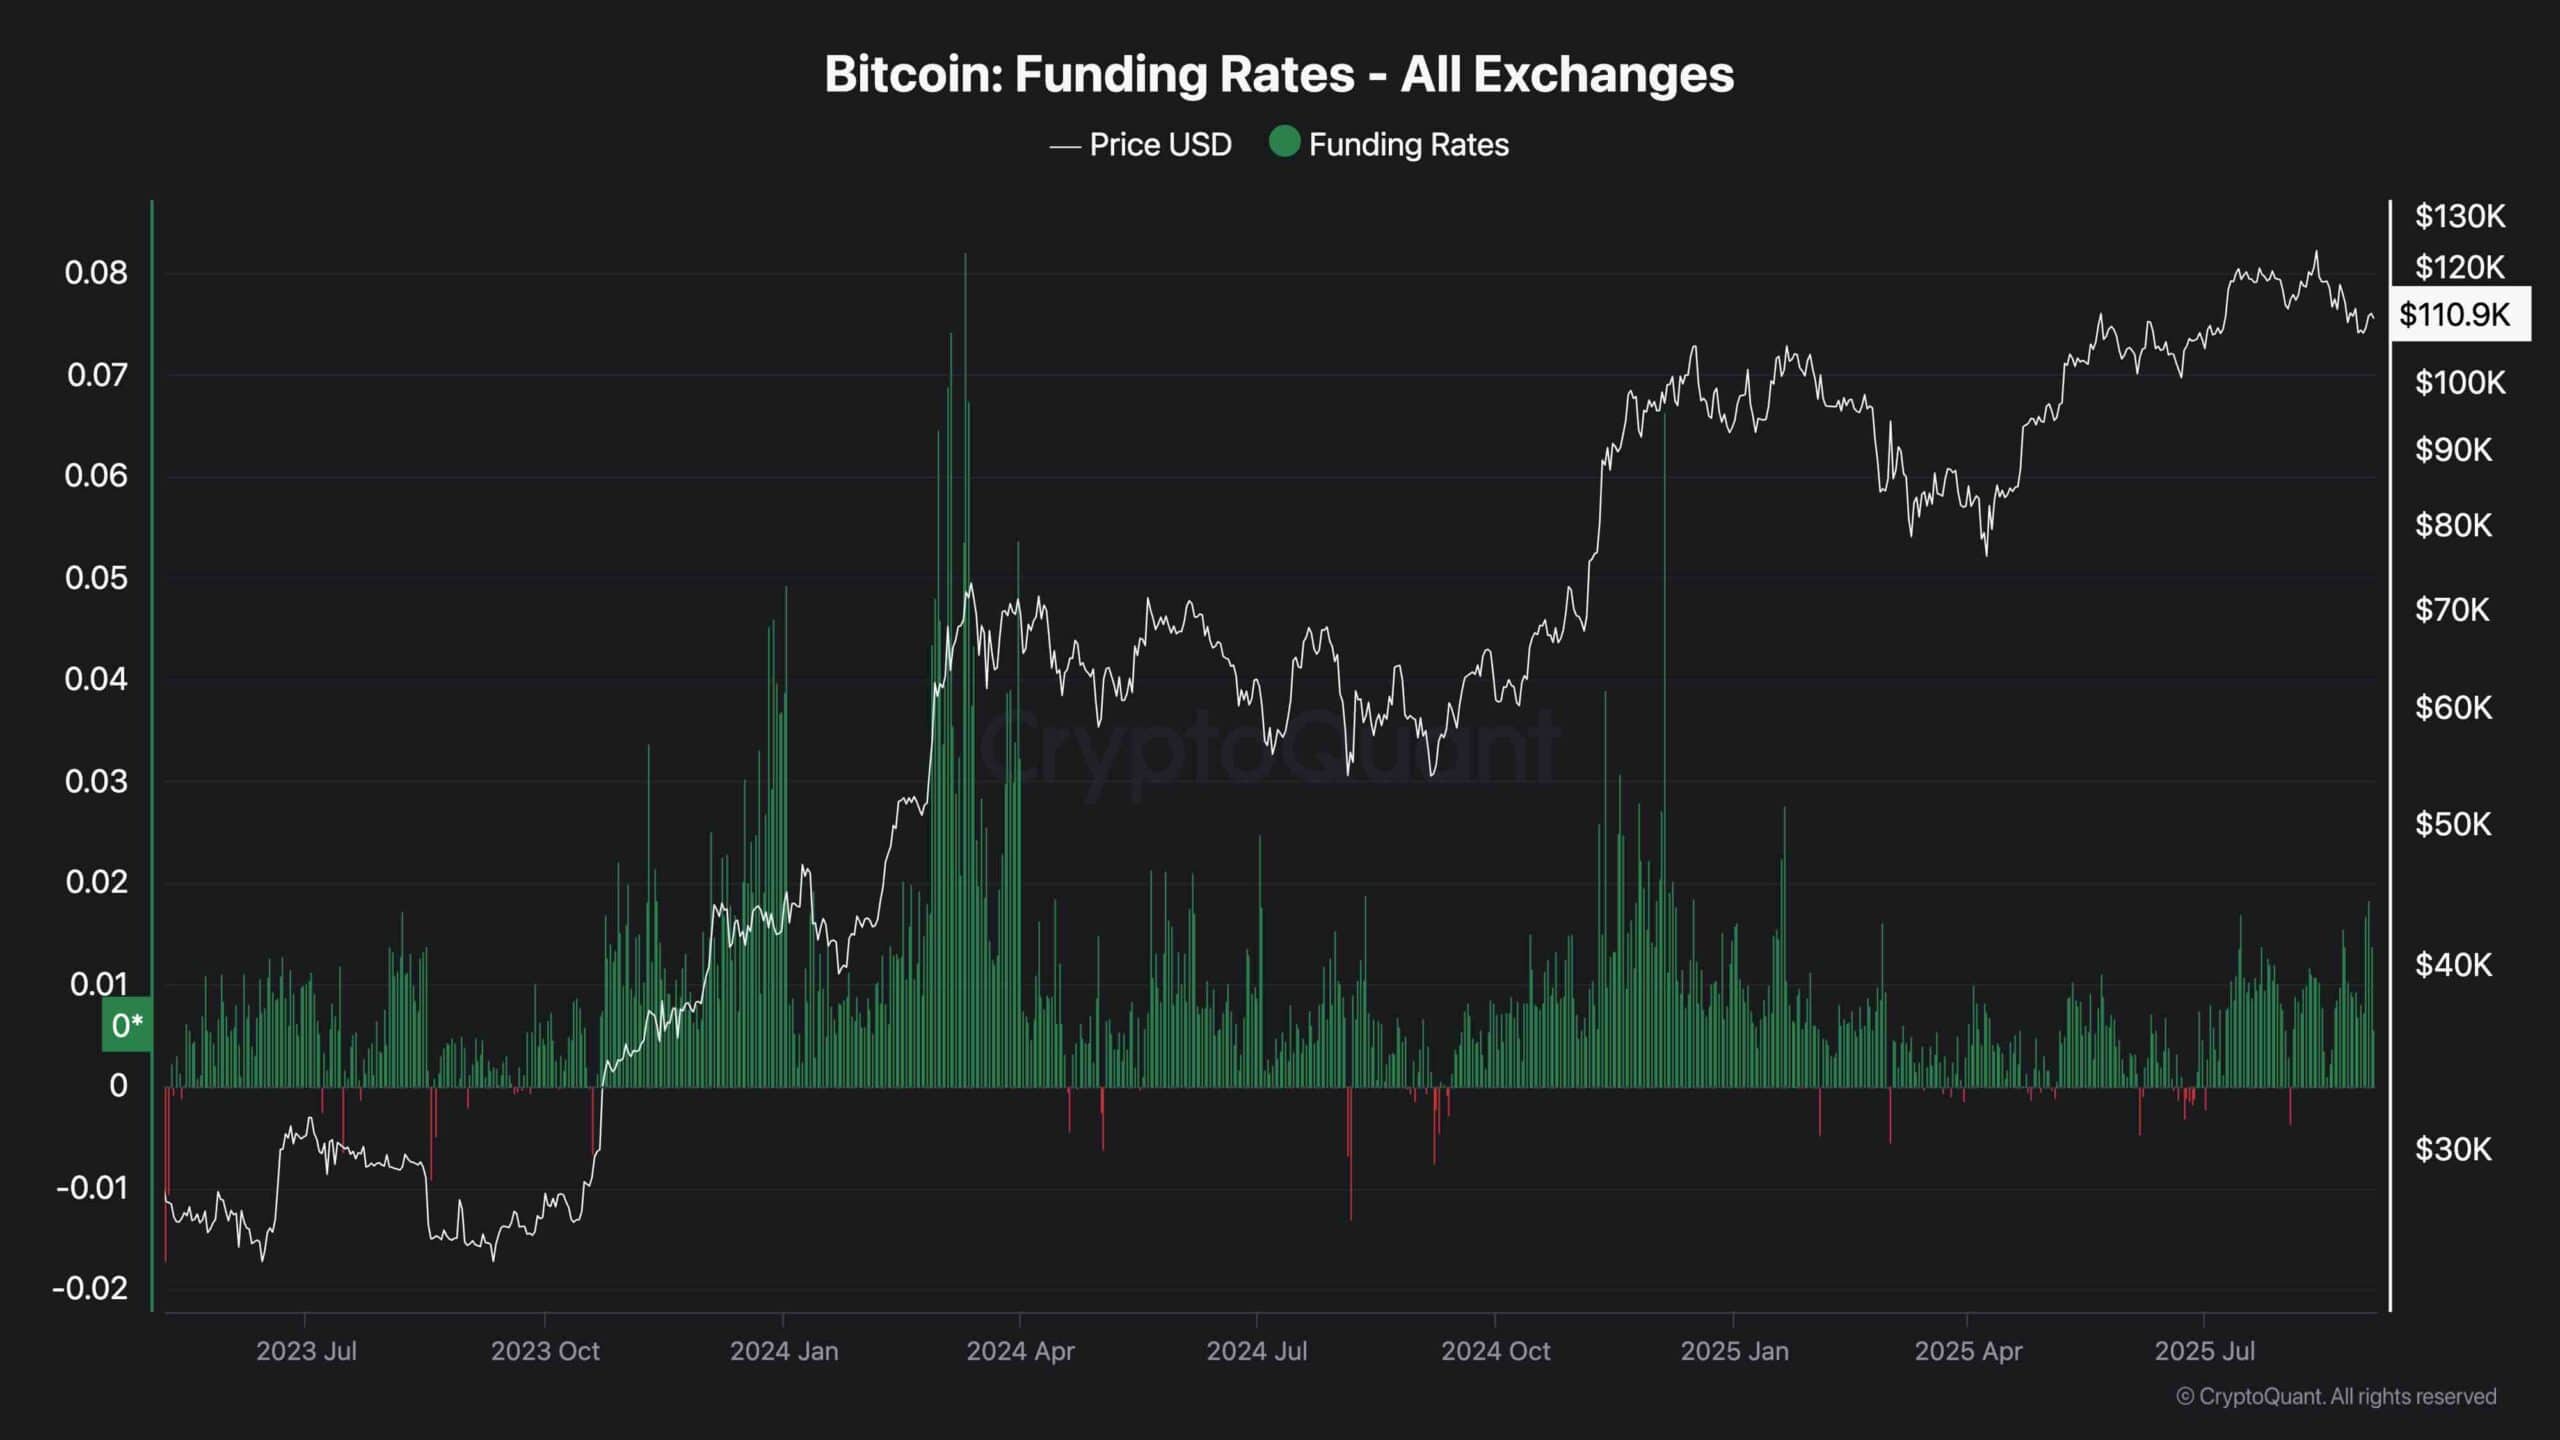
Funding rates across exchanges show that leverage remains tilted positive, though not at the extreme highs seen during previous peaks. This suggests that while long traders are still dominant, the market is not yet in a euphoric or overheated phase. Sustained positive funding means bulls continue to pay shorts, which could add pressure if the price consolidates for too long.
Interestingly, despite Bitcoin’s strong run earlier this year, funding rates have calmed significantly compared to the spikes seen in early 2024 and 2025. This indicates that speculative momentum has cooled, and accumulation may be underway rather than aggressive chasing. If funding rates remain moderate, it could provide a healthier foundation for the next impulsive move.