Ethereum Eyes $4,070 CME Gap as Bulls Charge Through Critical Resistance
Ethereum isn't asking for permission—it's taking ground. After smashing through a key technical zone, ETH now has the CME gap at $4,070 in its crosshairs. Traders are leaning in, charts are flashing green, and that old Wall Street crowd? They're still trying to explain why they called it 'a bubble' at $300.
Price action suggests the rally has legs. The $4,070 target isn't just another number—it's the last visible gap on CME's futures chart, a magnet for algorithmic traders and a psychological milestone for the market. Break that, and the FOMO starts for real.
Of course, nothing's guaranteed. Crypto moves fast, and today's breakout could be tomorrow's 'buy the rumor, sell the news' event. But for now? The path of least resistance points up. Just don't tell the guys in suits—they're still waiting for their 'blockchain, not Bitcoin' moment.
Price Pulls Back Near Technical Gap
Ethereum (ETH) is now trading close to $4,350, after falling from recent highs NEAR $4,800. The focus is on a CME futures gap between $4,050 and $4,100. These gaps occur when futures markets reopen after weekends and can often act as magnet levels for the price.
Notably, the last time ethereum filled a large gap like this, it went on to gain over 40% within weeks. Traders are now watching to see if the same pattern repeats.
#Ethereum Rushing To Close the CME Gap Sitting at 4,070$.
Last time we closed a large gap, we saw a +40% MOVE up in just weeks pic.twitter.com/WRrvePsDbt
— Bitcoinsensus (@Bitcoinsensus) August 18, 2025
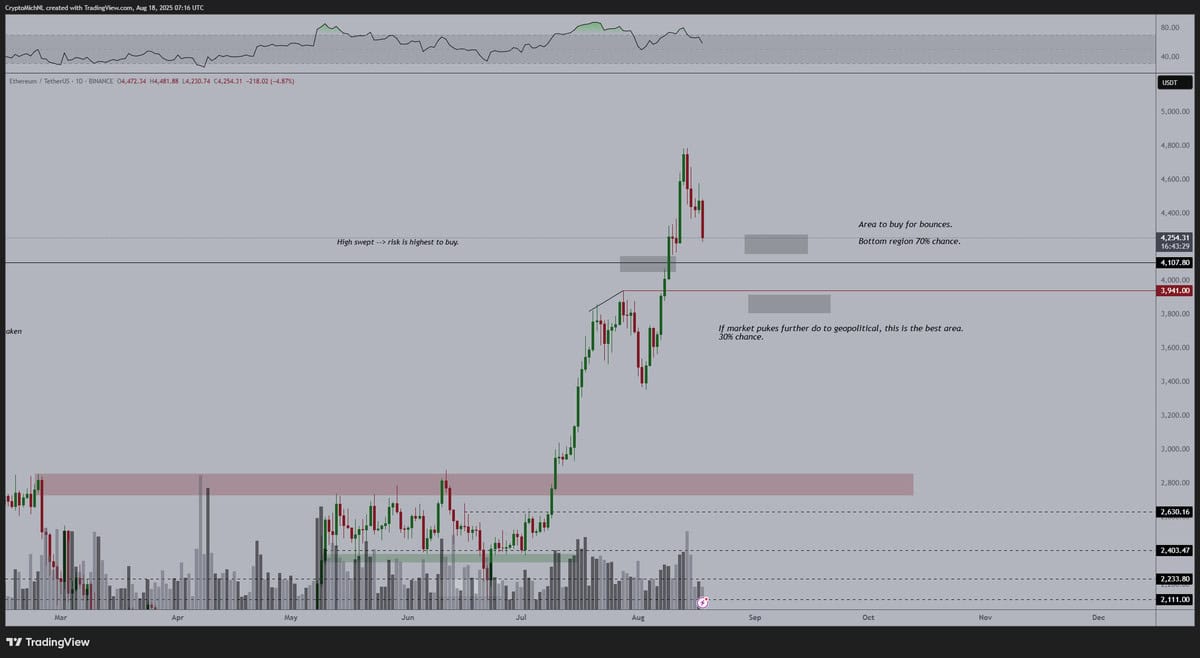
Analyst Michaël van de Poppe noted that Ethereum has entered the first support zone and may bounce here. “I think we’ll bounce from here, not the bottom,” he said, pointing to the area between $4,100 and $4,250. He labeled sub-$4,000 levels as a strong entry opportunity.
A second level near $3,941 is marked on his chart, with a lower chance of being tested unless global tensions increase. Volume is rising into this correction, suggesting buyers may step in at support. The RSI is falling but has not reached oversold conditions, giving room for further movement.

Retail Sells While Large Holders Accumulate
Data from CryptoQuant shows retail wallets have reduced their ETH exposure since March. Holdings have fallen from 10.5 million ETH to 8.7 million. At the same time, large investors have increased their positions.
“Retail is selling $ETH. Whales are stacking,” posted CryptoJack, suggesting larger players are using the drop to buy. This shift may point to longer-term confidence from institutions and experienced traders.
Retail is selling $ETH.
Whales are stacking $ETH.
FOLLOW THE SMART MONEY! pic.twitter.com/ZOtJhlOPQK
— CryptoJack (@cryptojack) August 18, 2025
Exchange Supply Falls to 3-Year Low
ETH on exchanges has dropped to 18.5 million—its lowest level in over three years. Mister crypto called attention to the trend, writing,
“$ETH is being taken off exchanges at record pace. SUPPLY CRUNCH INCOMING!”
A falling exchange balance often signals less selling pressure. The recent drop is sharp, shown in the chart’s final section, where supply drops steeply in just a few days.
Market Events to Watch This Week
Key macro events may influence short-term price movements. These include:
- Monday: Trump-Zelensky meeting in Washington
- Wednesday: July FOMC minutes
- Thursday: U.S. jobless claims
- Friday: Powell’s Jackson Hole speech
Recent inflation data (PPI) paused Ethereum’s all-time-high push. Traders are now watching for potential volatility around these upcoming developments.

