Ethereum on the Brink: Will ETH Shatter the $4K Ceiling in 2025?

Ethereum bulls are charging—again. The $4K resistance level isn't just a number anymore; it's a psychological battleground for traders who've seen this story play out before. Can ETH finally deliver the knockout punch?
The setup: A textbook consolidation pattern. After flirting with $3,800 last week, ETH's price action tightened like a spring. Volume tells the real story—whales aren't selling, they're accumulating.
Why $4K matters: Breaking this barrier isn't about round-number psychology. It's the gateway to retesting all-time highs. The last time ETH touched these levels, gas fees made bankers blush—now Layer 2 solutions actually make the network usable.
Watch the derivatives: Open interest in ETH futures just hit a 90-day high. Either someone knows something, or we're about to witness the most over-leveraged rekt since the last Fed meeting.
The bottom line: Markets climb walls of worry—and right now, ETH's chart is giving Wall Street's 'risk managers' night sweats. Whether it breaks up or down, one thing's certain: the crypto casino never closes.
Technical Analysis
By ShayanMarkets
The Daily Chart
On the daily chart, ETH is consolidating just below the $4,000 level after breaking through key resistance at $3,300. The asset is firmly above both the 100-day and 200-day moving averages, which are also starting to curl upward following a bullish crossover around the $2,500 mark, suggesting a strong uptrend structure.
The next major level of interest is the previous high at $4,100, while any downside correction could find support between $3,300 and $2,900.
Moreover, the RSI on the daily remains elevated, hovering around 78, which signals overbought conditions. That said, a sharp reversal hasn’t followed yet, implying that momentum remains intact for now. If the buyers can maintain pressure without a significant correction, ETH could build the base needed for continuation toward the previous highs of December 2024.
The 4-Hour Chart
On the 4H chart, ETH is forming a descending triangle just beneath resistance, with a series of lower highs pressing into the $3,800 zone. The RSI has also bounced from the 50 level, currently sitting NEAR 56, showing a mild recovery in momentum after the recent pullback. The structure suggests that a breakout above the descending trendline could trigger another wave higher.
If the pattern breaks to the downside, however, the immediate support to watch is the $3,500 range. A move below that WOULD put the $3,200 zone back into play. For now, volatility is compressing, and a decisive breakout in either direction is likely in the coming sessions.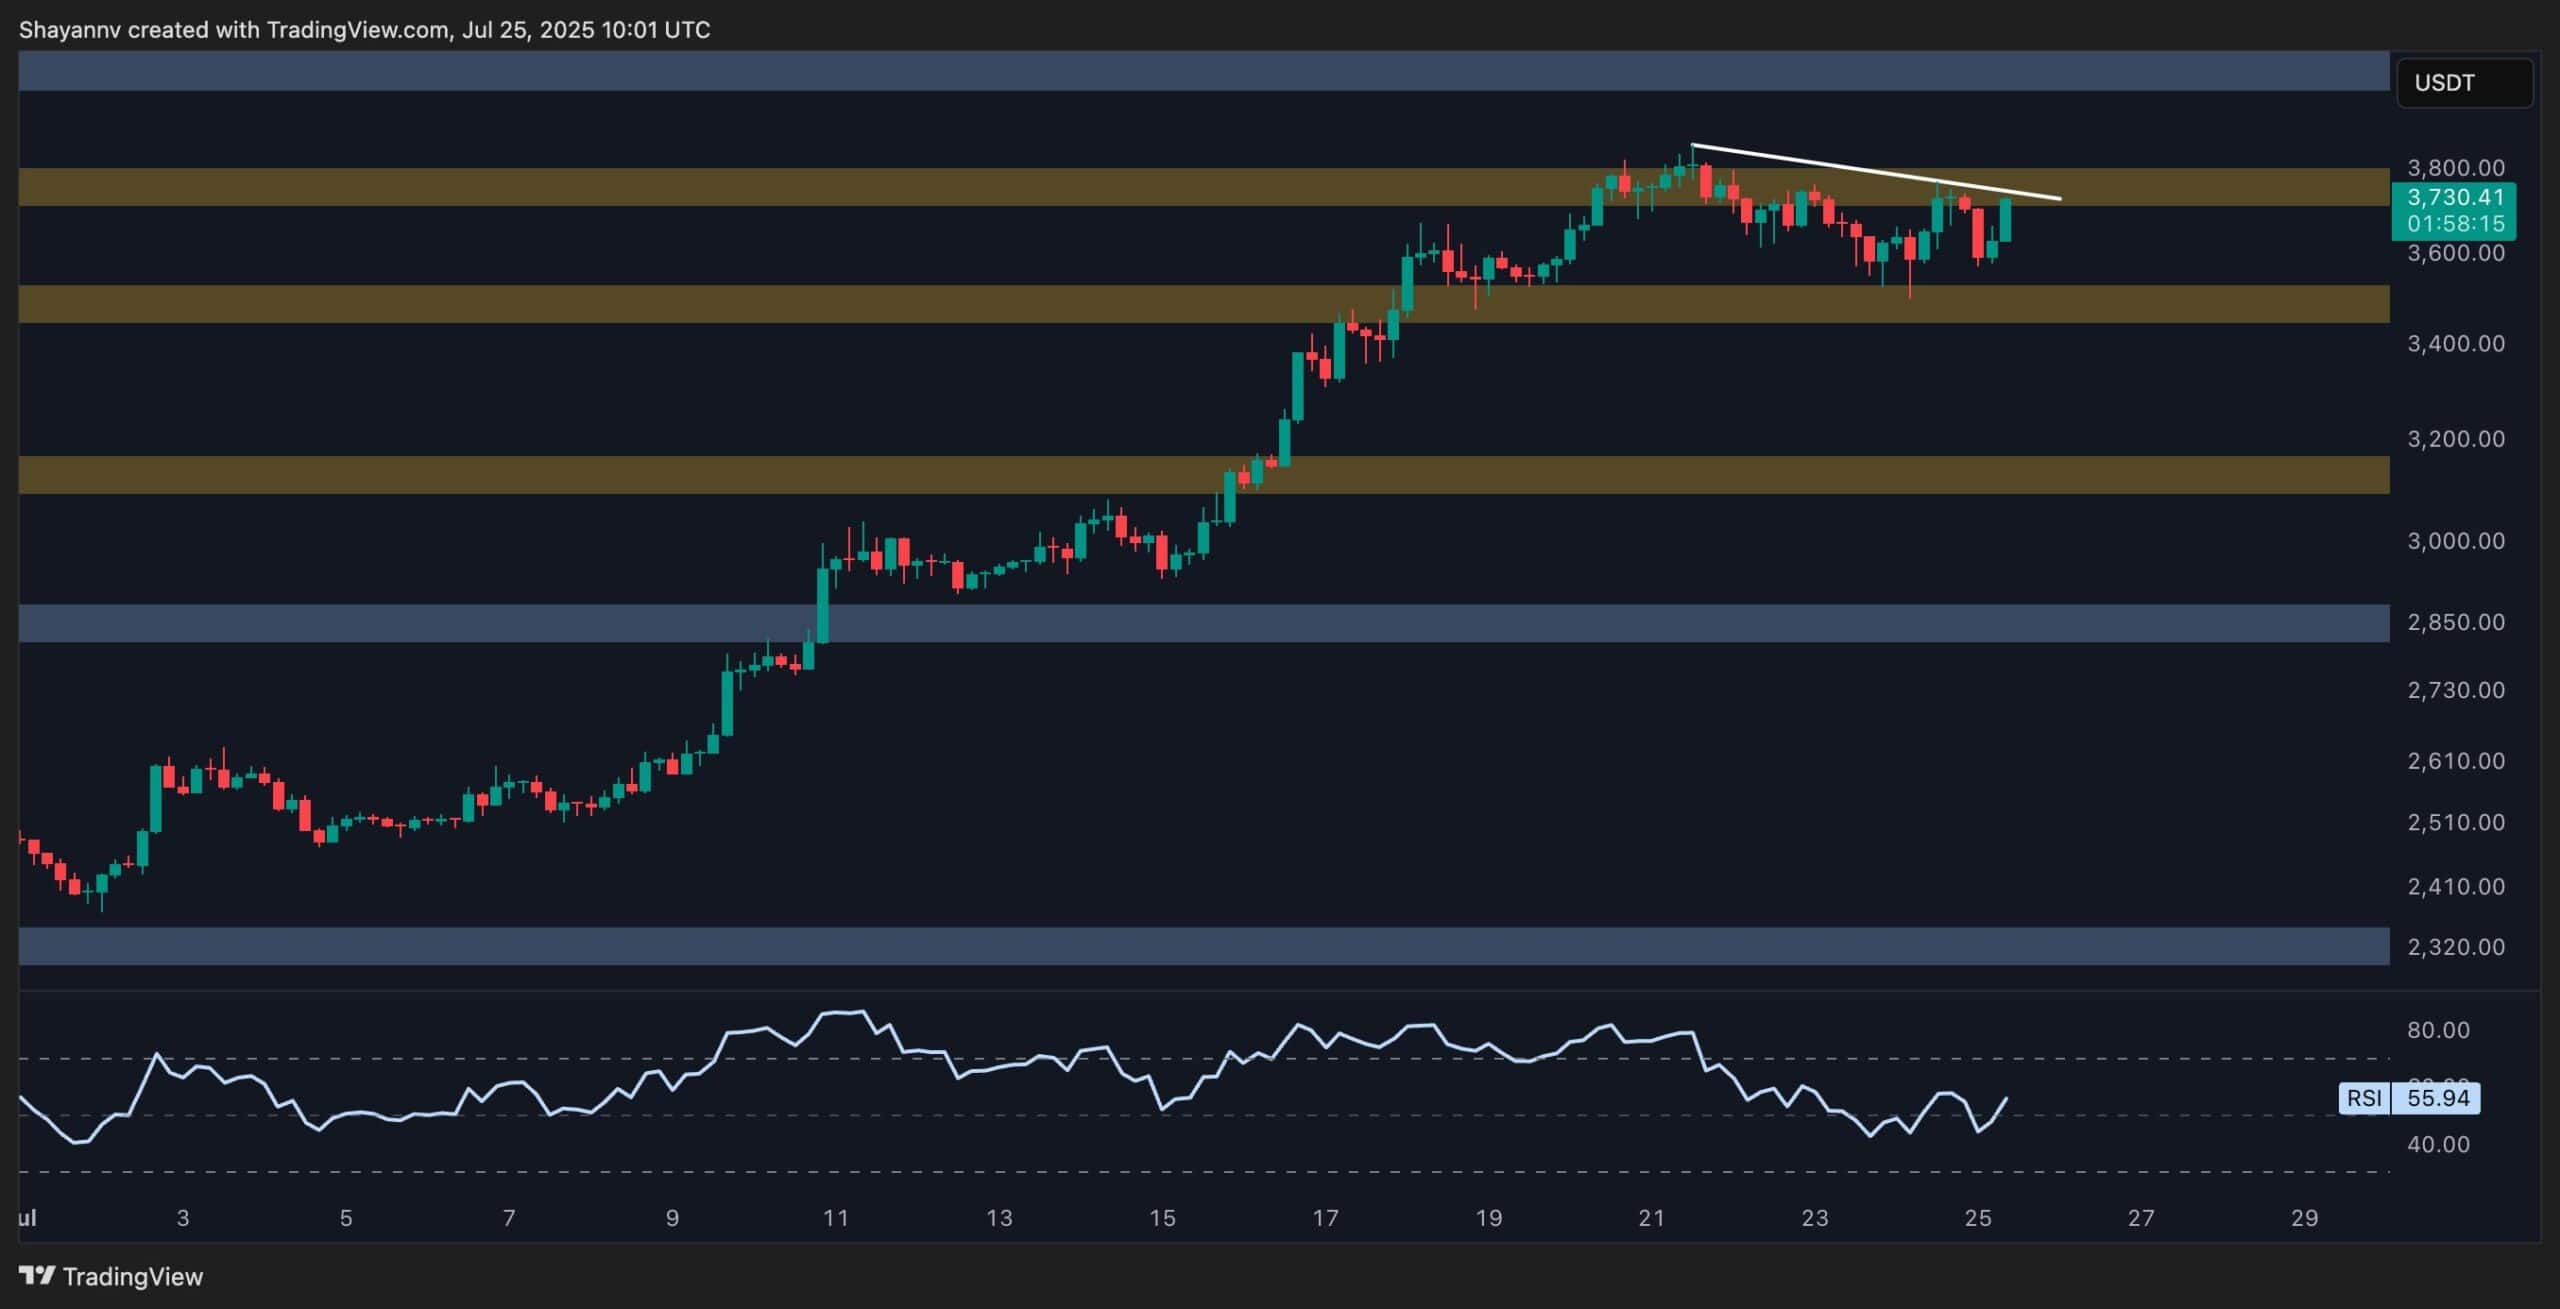
On-Chain Analysis
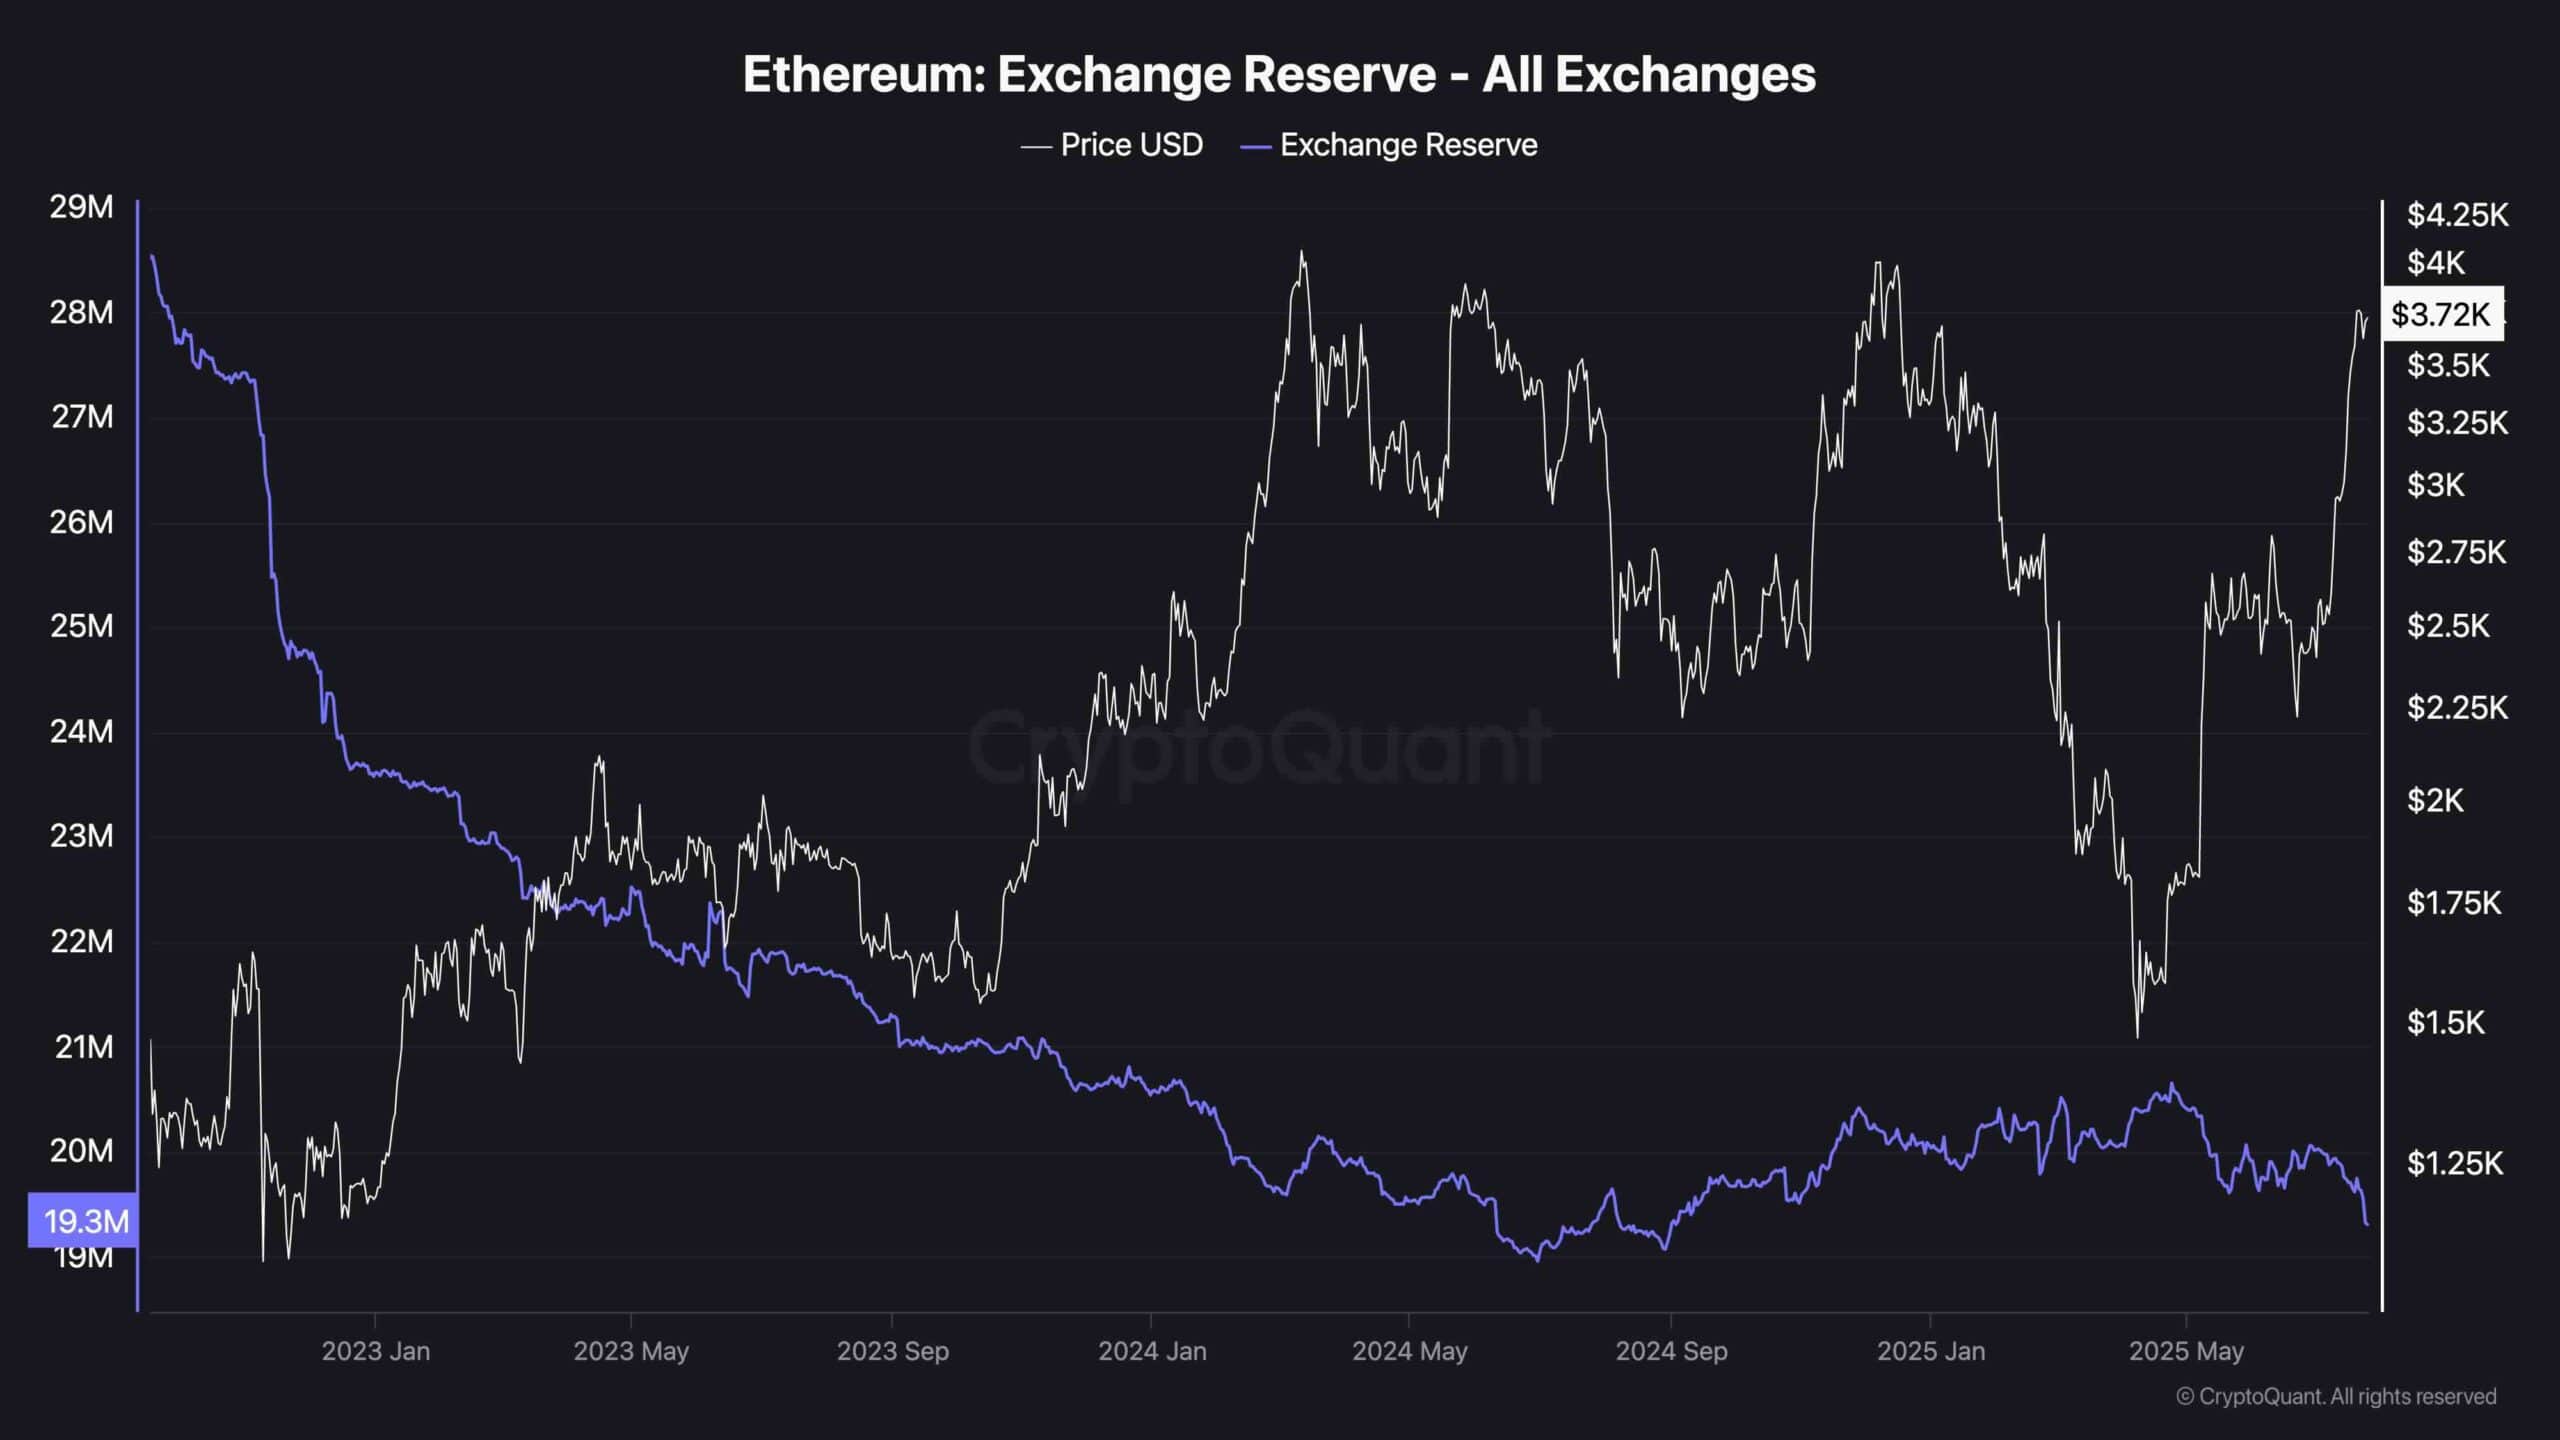
Ethereum Exchange Reserve
The ethereum exchange reserve continues to decline, now sitting at a multi-year low of around 19.3 million ETH. This sustained downtrend reflects a broader shift in market behavior, where investors and institutions are increasingly moving their ETH off centralized exchanges, either into cold storage, staking platforms, or DeFi protocols. Historically, such a reduction in exchange-held supply often coincides with bullish price trends, as it signals reduced sell-side pressure and a stronger conviction among holders.
What’s notable is that this drawdown in reserves has continued even as ETH surged toward $3,800, indicating that holders aren’t rushing to take profits at current levels. Instead, this behavior reinforces the idea of long-term accumulation and reduced willingness to sell, especially during key breakout phases. As long as this reserve continues trending downward, it adds a strong underlying support to Ethereum’s macro bullish structure.