AAVE Plunges 13% in a Week – Here’s the Make-or-Break Support Zone to Watch

DeFi's lending heavyweight AAVE takes a hit—down double digits as traders hunt for the bounce.
Blood in the streets? Not quite. But the 13% weekly drop has degens sweating over their leveraged longs. The charts whisper one truth now: There’s a critical demand zone that could either spark a relief rally… or confirm deeper pain ahead.
The Fibonacci lifeline
All eyes on the 0.618 retracement level—a classic magnet for reversals when alts get oversold. AAVE’s price action has flirted with this zone before, and history doesn’t exactly repeat… but it often rhymes (especially when liquidity’s at stake).
Whales vs. diamond hands
Market makers love this volatility—pocketing premiums while retail FOMO fades. Meanwhile, protocol loyalists point to AAVE’s ironclad fundamentals: TVL isn’t evaporating, just migrating to higher yields like crypto’s version of musical chairs.
One hedge fund PM quipped: 'Another day, another ‘healthy correction’ in DeFi—until your portfolio looks like a Byzantine failure.' The bounce zone’s the litmus test. Hold or fold? The charts decide.
AAVE Price Approaches Potential Support
Aave (AAVE) is trading around $284 after a painful drop over the last week. The token has lost more than 13% in that time and is down nearly 6% in the past 24 hours. Volume remains high, with over $790 million traded in a day.
Analyst Ali Martinez suggests that a MOVE to $270 could come next, calling it a “reload zone.” This area is just above the 0.618 Fibonacci level at $247.56 and lines up with a previous resistance area. If the price holds here, it may become a short-term base for buyers looking to step in again.
$AAVE could pull back to $270 before making a move toward $560. Watch this potential reload zone closely! pic.twitter.com/GXVECNvu1H
— Ali (@ali_charts) July 24, 2025
Key Levels and Trend Indicators
On the chart, the projected move points to a pullback NEAR $270, followed by a possible climb toward $400 and later $560. These levels match historical price reactions and Fibonacci extension zones.
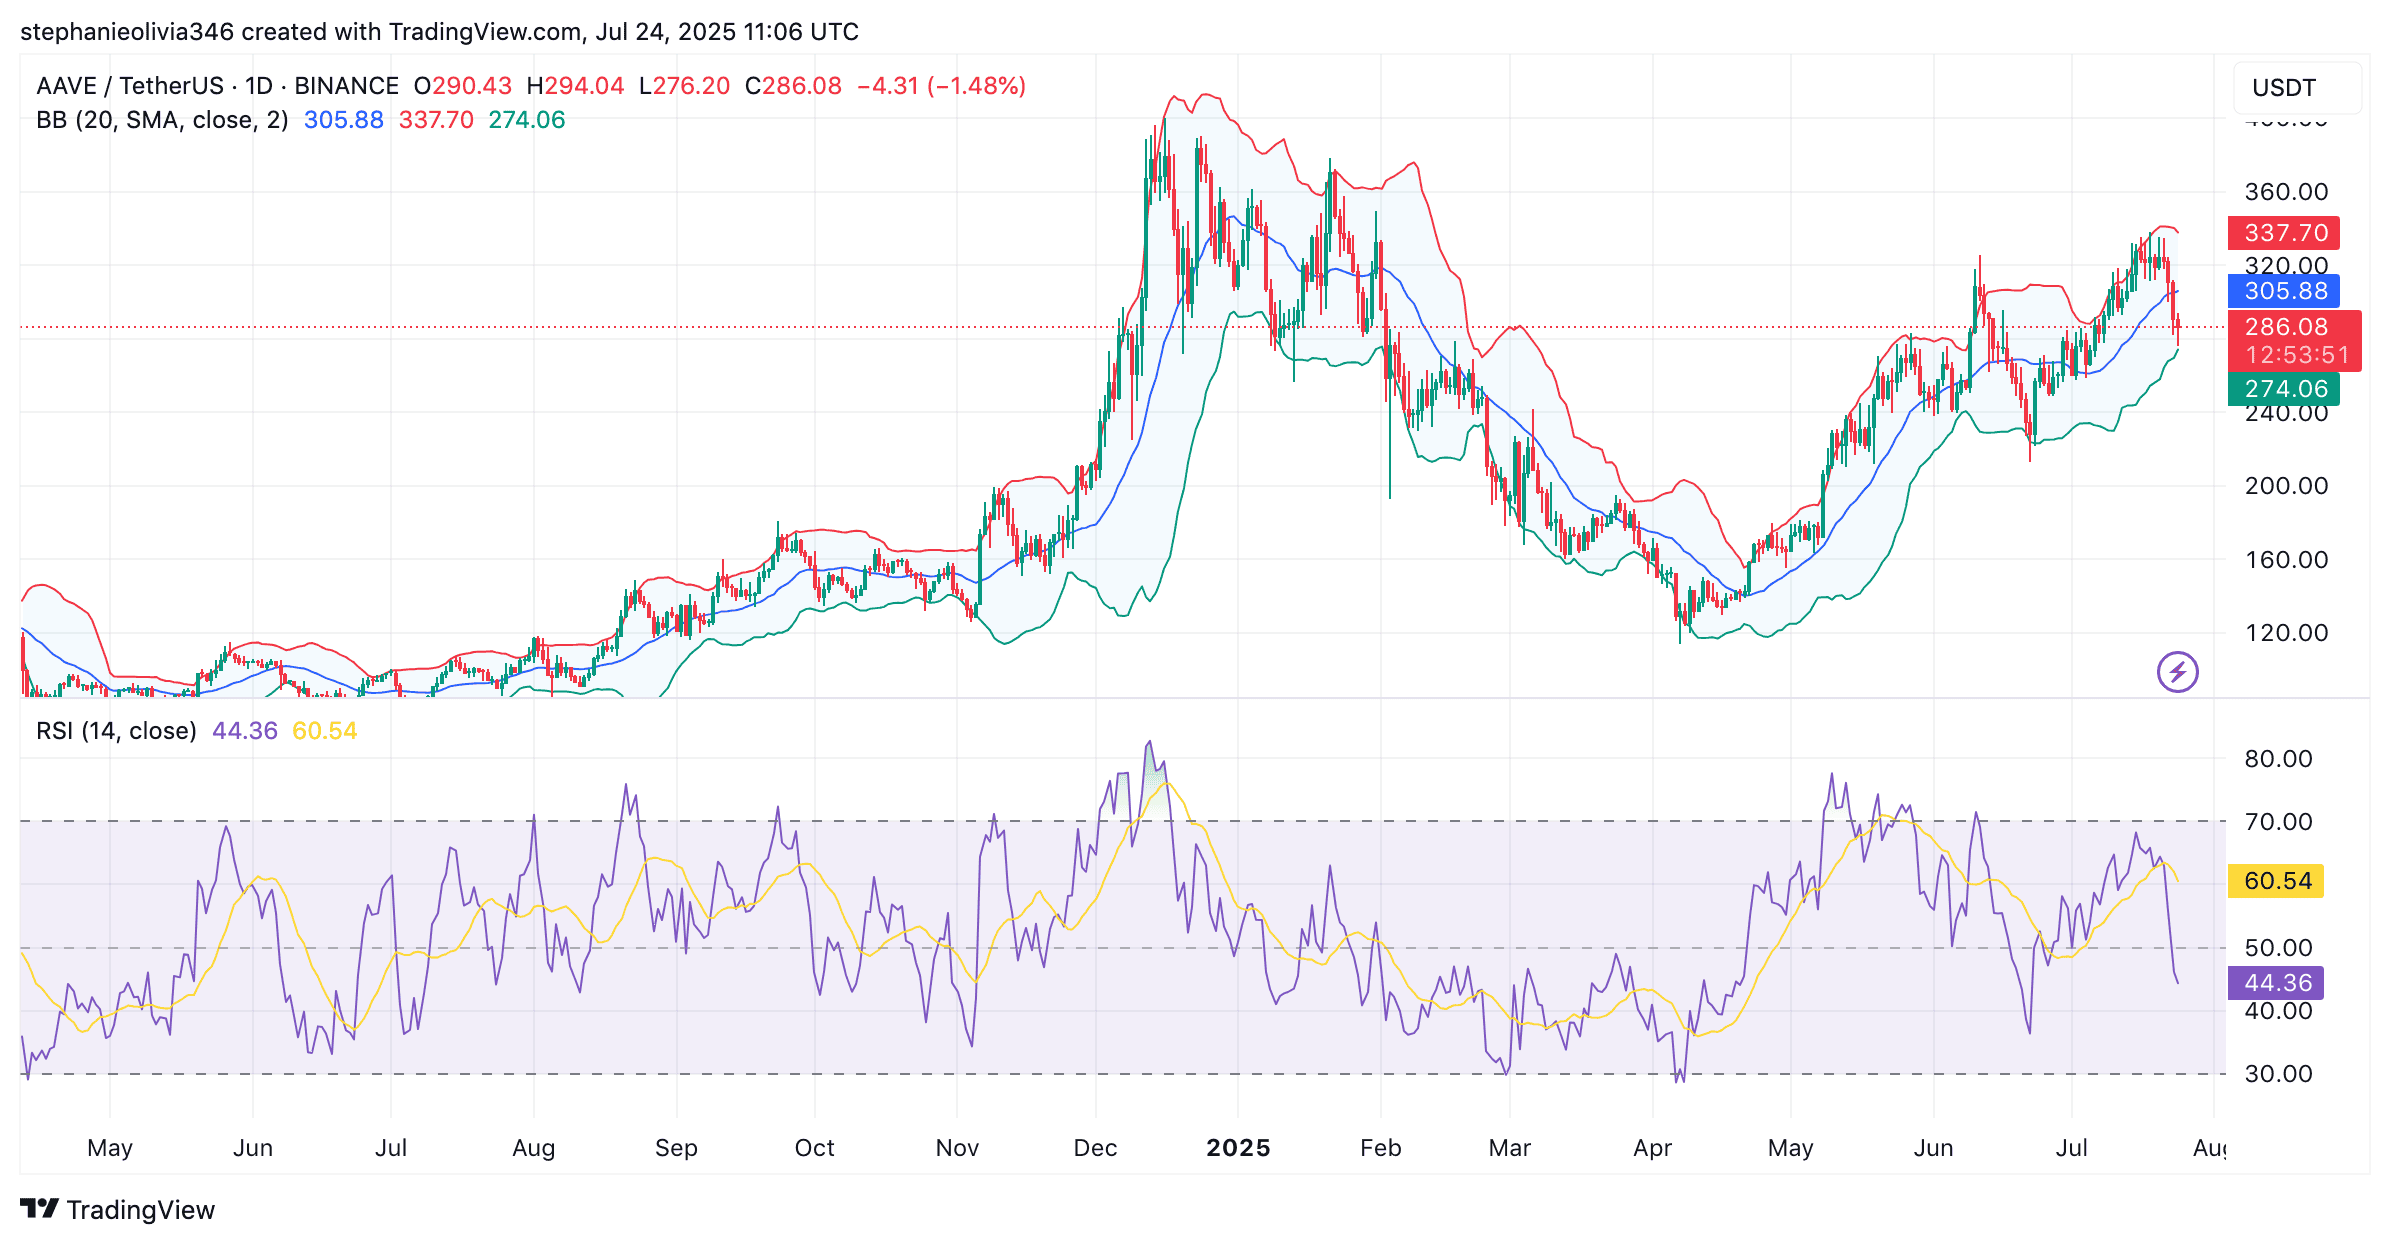
Short-term momentum has cooled. The RSI sits at 44.12, down from the recent average of 60.52. AAVE is also below the midline of its Bollinger Bands, which is now around $305. The lower band is closer to $273, suggesting this area could act as support if selling continues.
DeFi Growth Supports Long-Term Outlook
Since April, DeFi protocols have added around $49 billion in new value. Aave accounts for $15 billion of that, which is nearly one-third of the total. This places it among the top contributors in the space.
In addition, the protocol is planning to launch a version of its lending platform on Kraken’s Ink blockchain. The move has already received over 99% support in a governance vote and now heads to a final round of approval from the DAO.
AAVE is hovering near a zone that has seen strong reactions before. Analyst Sjuul from AltCryptoGems said,
“AAVE is at an interesting spot… a bounce here and the bullish structure is safe.”
Price action in the coming days may confirm whether buyers step back in at this level.

Log in to Reply
Log in to comment your thoughtsComments
Related Articles
|Square
Get the BTCC app to start your crypto journey
Get started today Scan to join our 100M+ users