Ripple Price Explosion: Can XRP Shatter Its All-Time High in This Frenzied Bull Run?

XRP rockets upward as traders bet big on a historic breakout.
The sleeping giant awakens—Ripple's native token surges 40% in a week, flirting with its 2018 peak. Market whispers grow louder: this could be the run that finally cracks the $3.40 ceiling.
Why the sudden frenzy? Three catalysts fuel the fire:
1. Institutional FOMO hits critical mass as Wall Street warms to crypto again (better late than never).
2. The SEC lawsuit overhang finally lifts—turns out years of legal limbo was just a 'buy the rumor, sell the news' setup.
3. Cross-border payment volume spikes 210% YoY as banks actually start using the damn thing.
Technical indicators scream 'overbought'—but since when did that stop a proper crypto rally? The last resistance before ATH territory sits at $2.80, a level that crumbled faster than a Bitcoin maximalist's arguments during this run.
Just remember: in crypto, 'this time it's different' are the four most expensive words in history. But hey—at least the volatility beats watching your savings account collect 0.5% interest.
Technical Analysis
By ShayanMarkets
The USDT Pair
The XRPUSDT chart is showing a powerful breakout above $2.30 after months of sideways action. The price broke out of a falling wedge pattern that had been forming since late 2024.
The wedge breakout was accompanied by a strong bullish candle that closed well above the 50-day and 200-day moving averages, both located around the $2.30 zone. XRP is now pushing into a major resistance area at $3.00, a zone that previously acted as a supply ceiling multiple times during the past year.
The rally has been sharp, and the RSI has entered extremely overbought territory at 80. Historically, such RSI spikes have led to corrections or sideways consolidation before continuation. As long as XRP holds above the 100-day and 200-day moving averages in the coming days, the path toward $3.40 and even $4.00 opens up. However, a close below the MAs could trigger profit-taking and drag the price back below $2.00.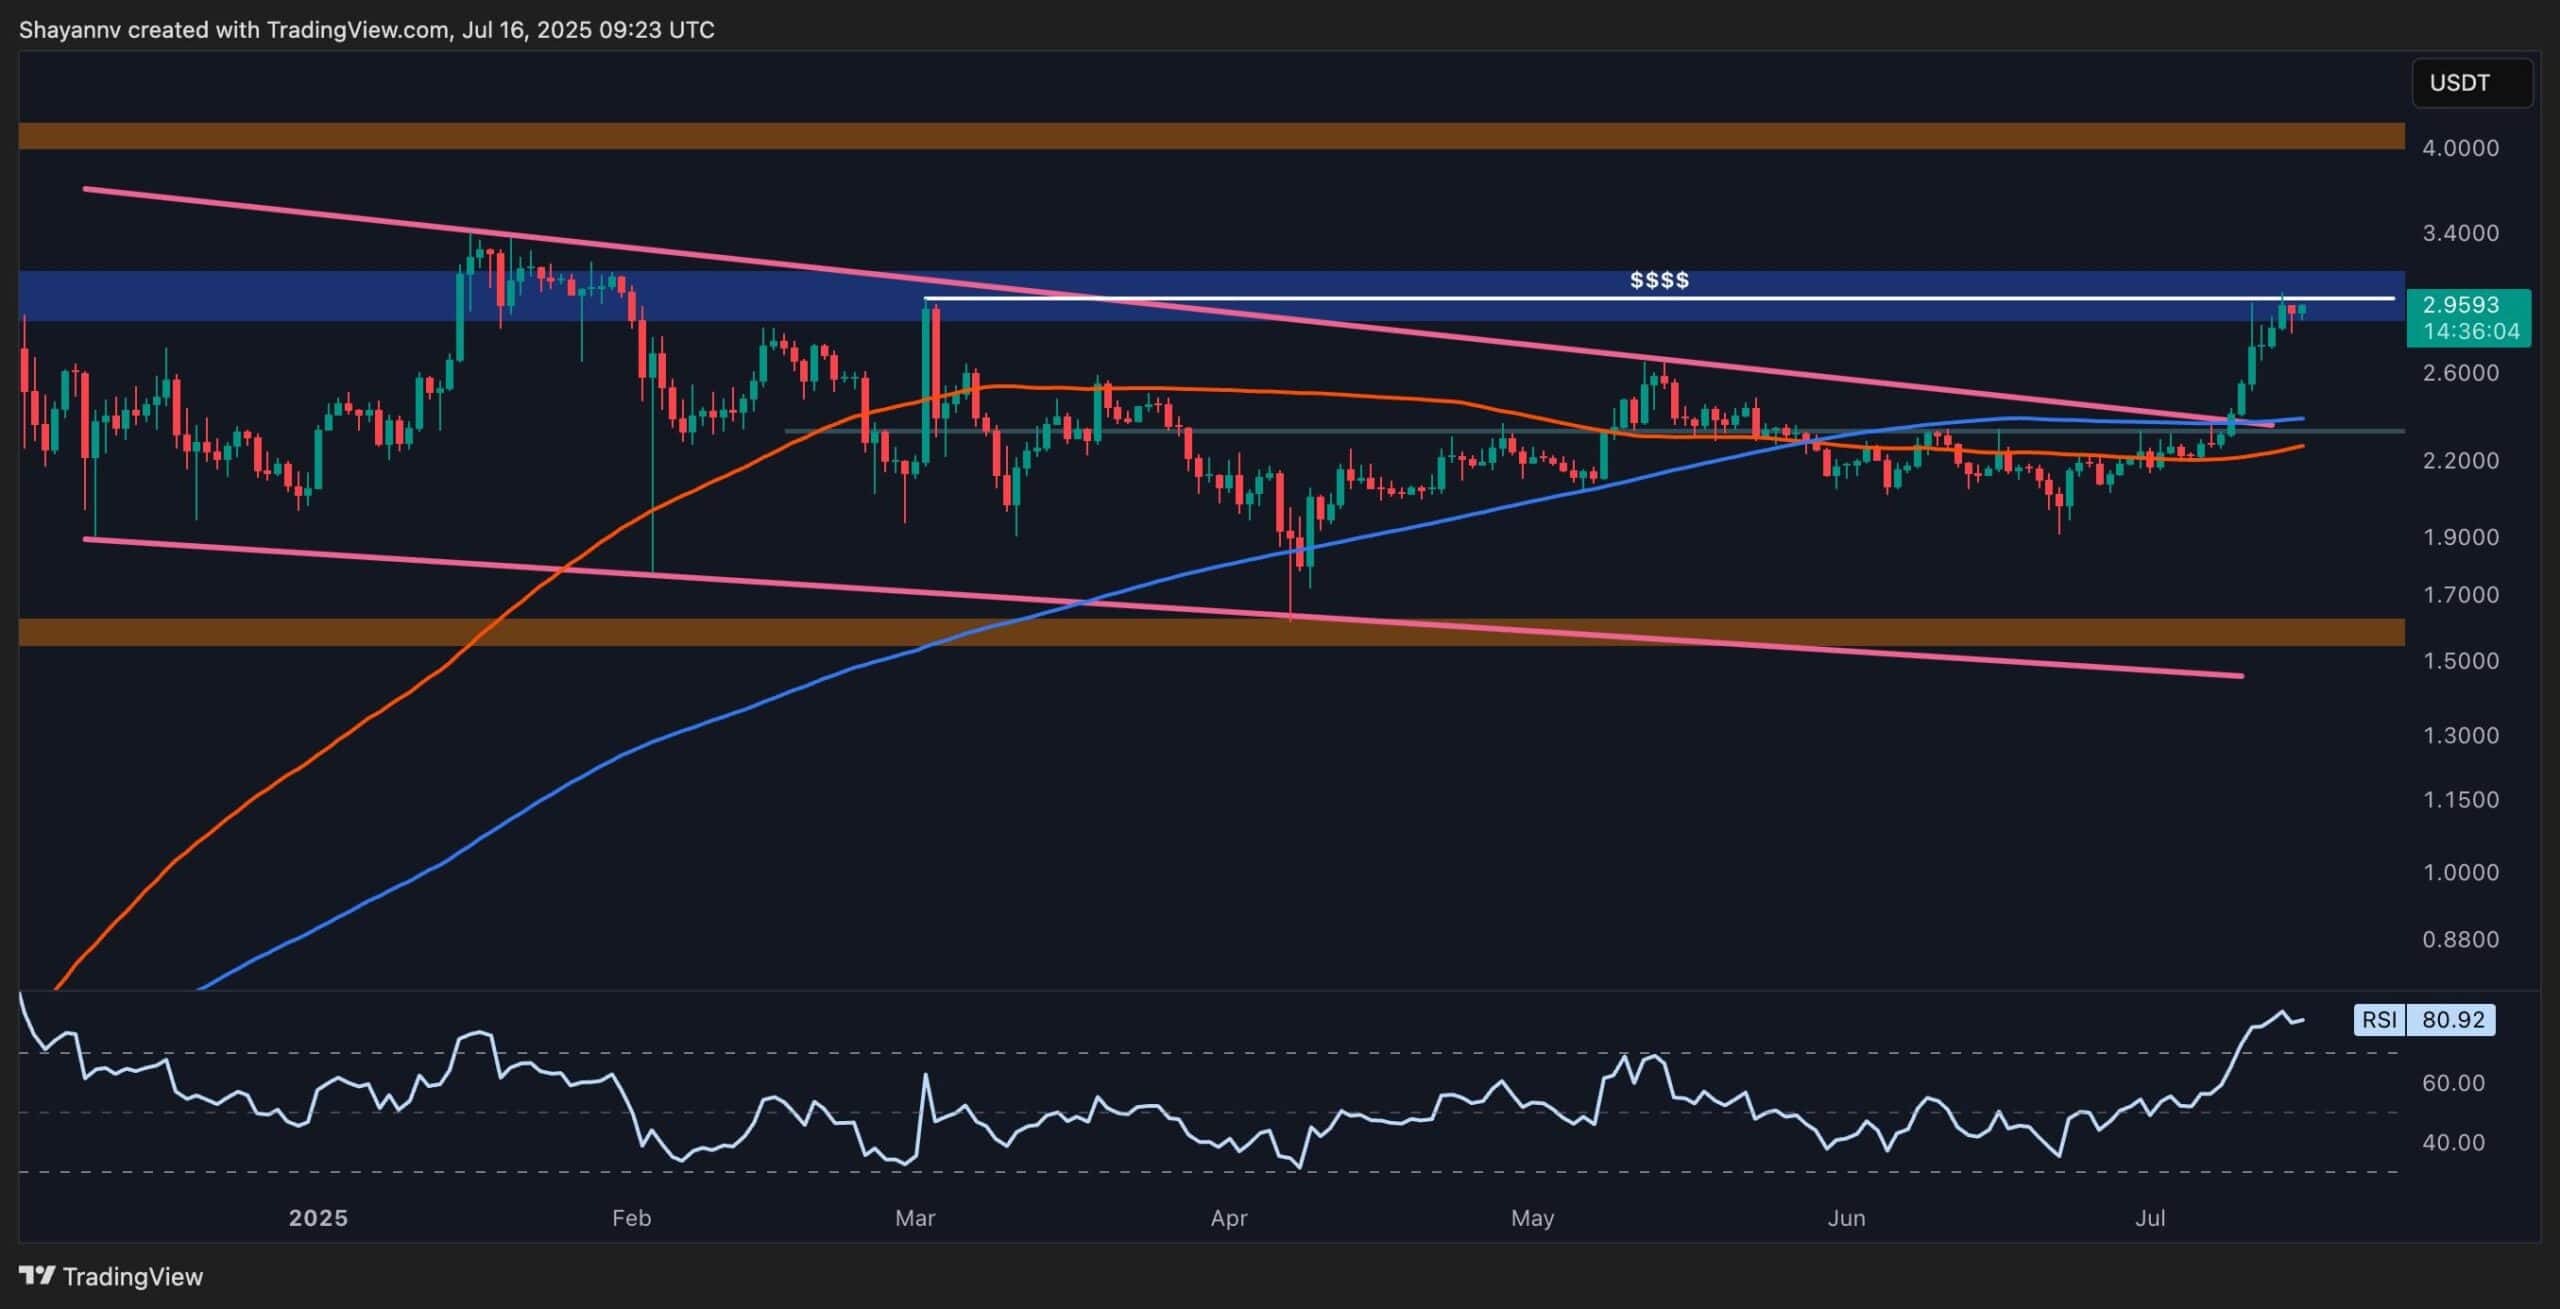
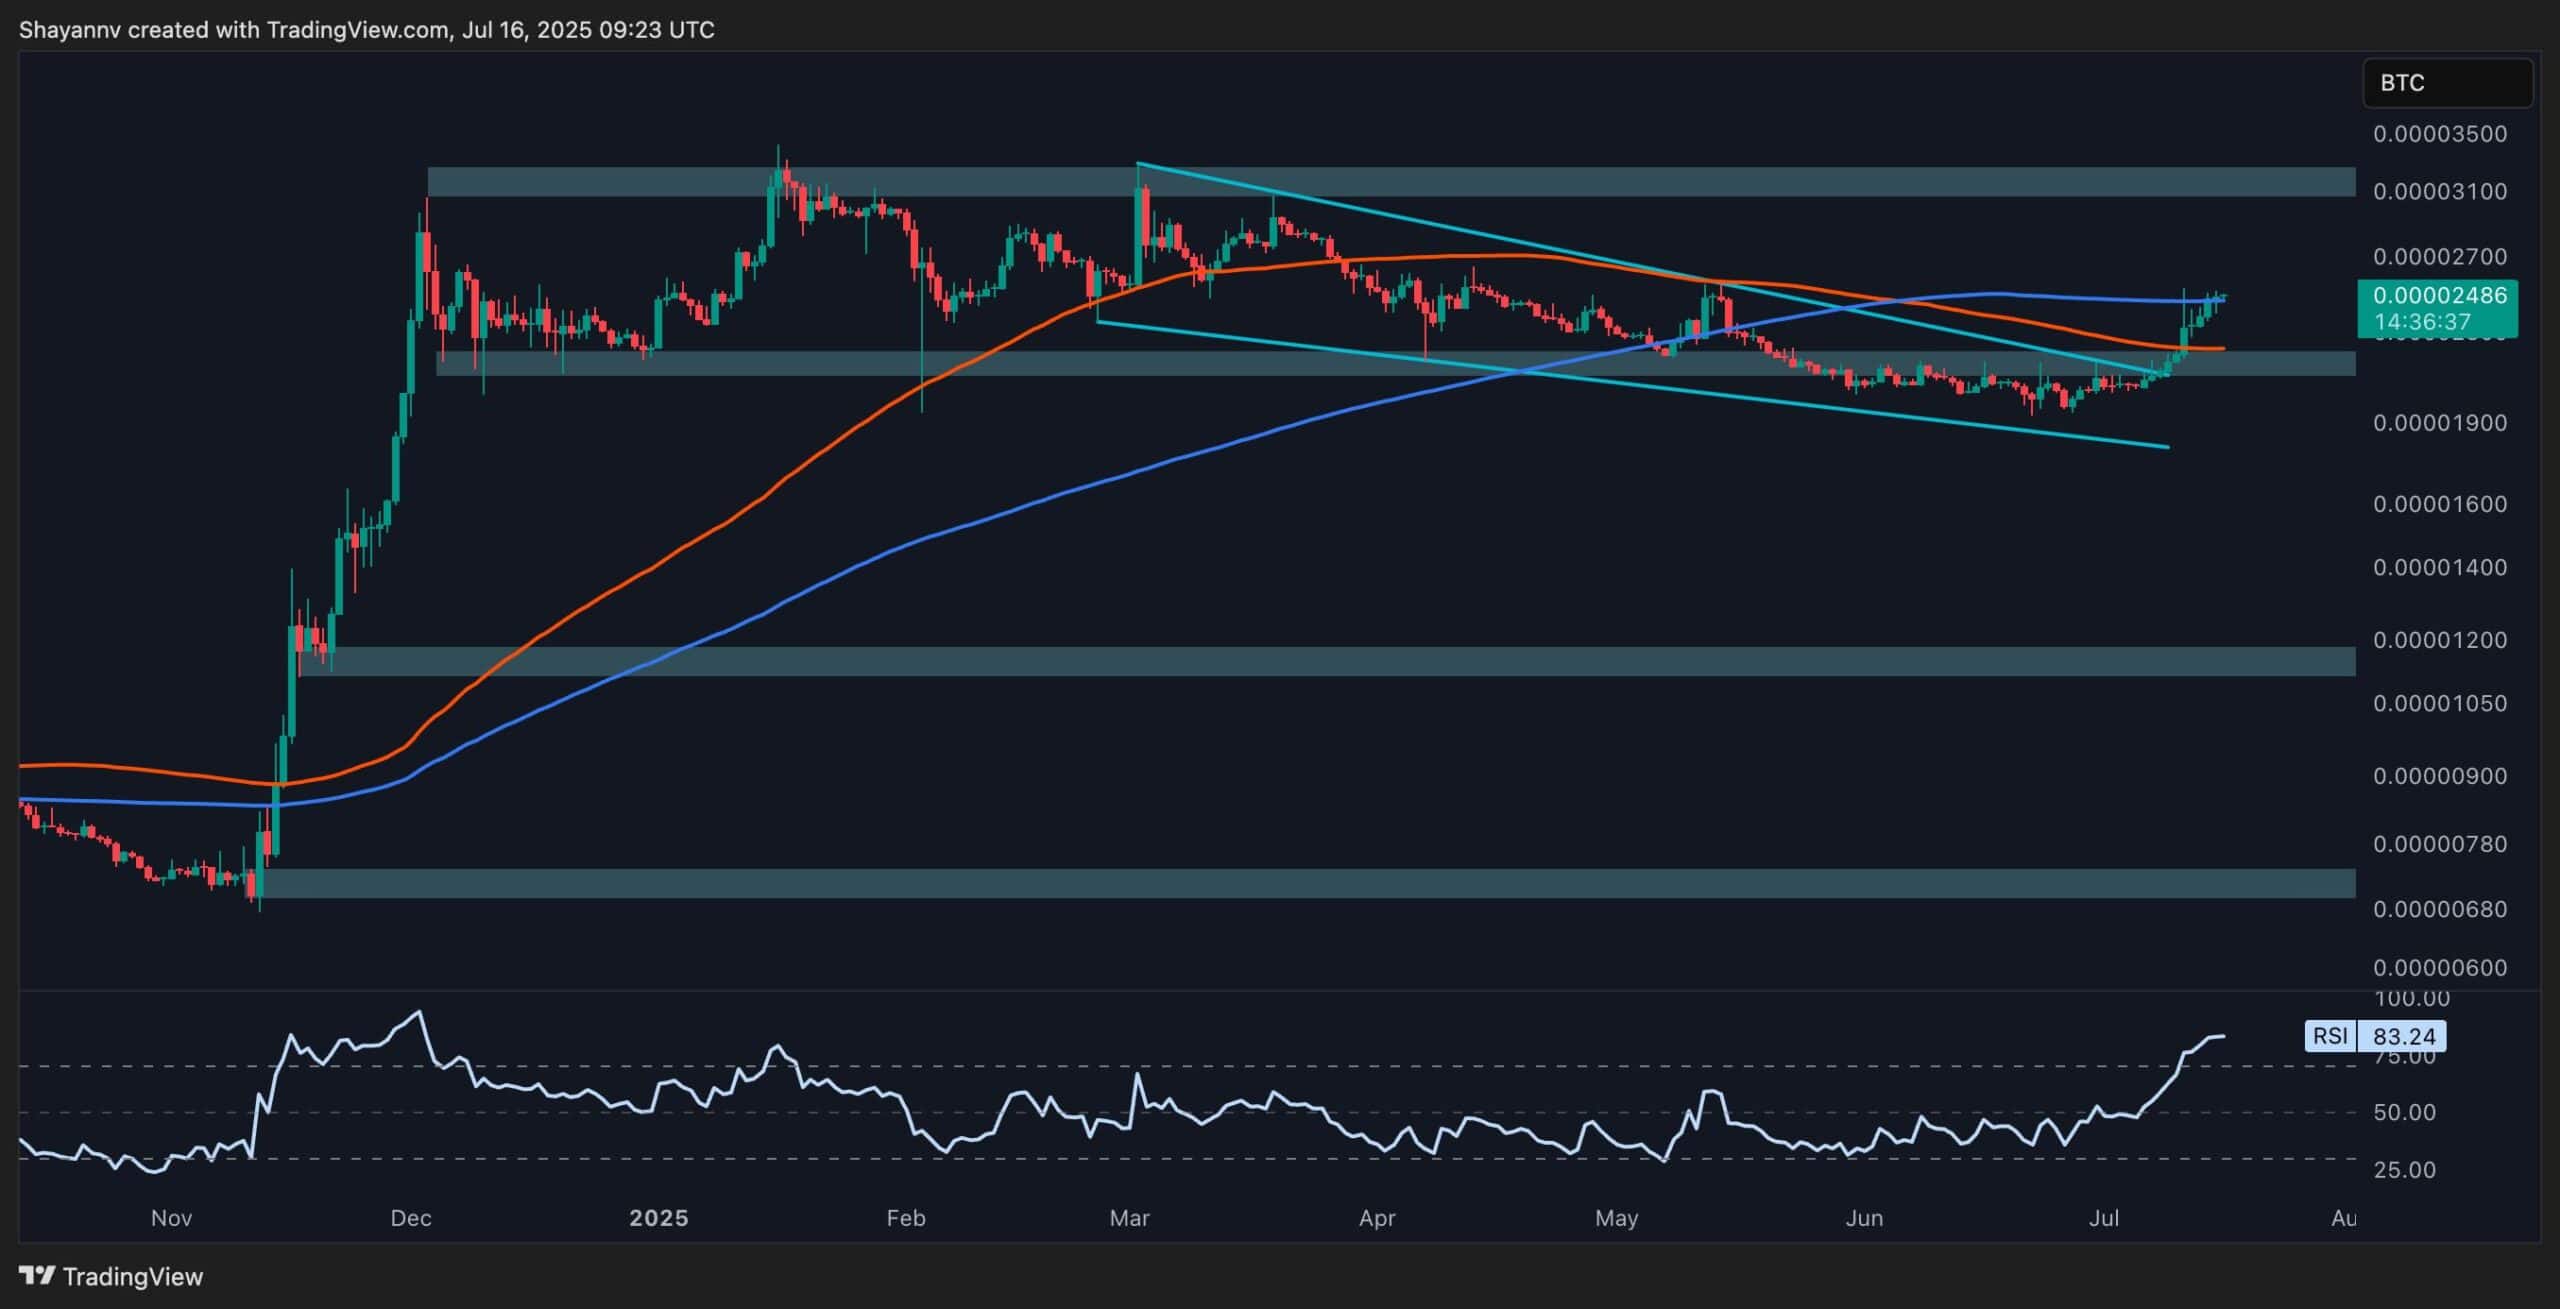
The BTC Pair
The XRP/BTC pair also confirms this momentum shift. The price has broken out of a falling wedge structure and flipped the key 2,200 SAT range into support. This is significant, as XRP had been trending downward against BTC for the majority of 2025. The breakout invalidates the bearish market structure and suggests a new trend phase could be developing.
Currently sitting around 2,500 SAT, XRP/BTC is testing its 200-day moving average and is trying to make higher highs and higher lows above it. Moreover, the RSI on this pair is also overbought at 83, suggesting the rally may be overextended in the short term.
The next significant resistance lies around 3,100 SAT, a zone that acted as a major distribution region during XRP’s last bullish leg. If XRP/BTC can consolidate above the 2,400 SAT level, the buyers will likely aim for this zone in the next impulse.