Ethereum Teeters: Will $2K Support Crack as Bulls Lose Steam?

ETH’s rally hits a wall—traders brace for a potential plunge toward $2,000 as buying pressure evaporates. The second-largest crypto by market cap now faces its first real stress test since last month’s rally.
Technical indicators flash warning signs: RSI noses below 50, volume dries up, and that ’unstoppable’ institutional demand? Nowhere to be seen. Classic case of ’buy the rumor, sell the news’ as ETF hype fades faster than a memecoin’s utility.
Meanwhile, Bitcoin maximalists smirk—their ’flippening’ schadenfreude grows with every failed ETH breakout. But don’t count Vitalik’s creation out yet. The Merge’s structural upgrades still position Ethereum as the chain to beat for smart contracts. Even if Wall Street’s latest ’crypto expert’ just discovered gas fees exist.
Technical Analysis
The Daily Chart
Ethereum is currently consolidating below the major resistance at $2,800, which aligns with the 200-day moving average. The uptrend that began NEAR $1,500 has paused, and the RSI has slightly dropped below 70, reflecting weakening bullish momentum.
Despite this, the price remains above the 100-day MA and the previous breakout zone near $2,200, indicating structure remains bullish unless those levels are lost. A clean breakout above $2,800 WOULD open the path toward the $3,400–$3,600 supply zone. On the other hand, failure to do so could trigger a retest of the $2,200 demand block.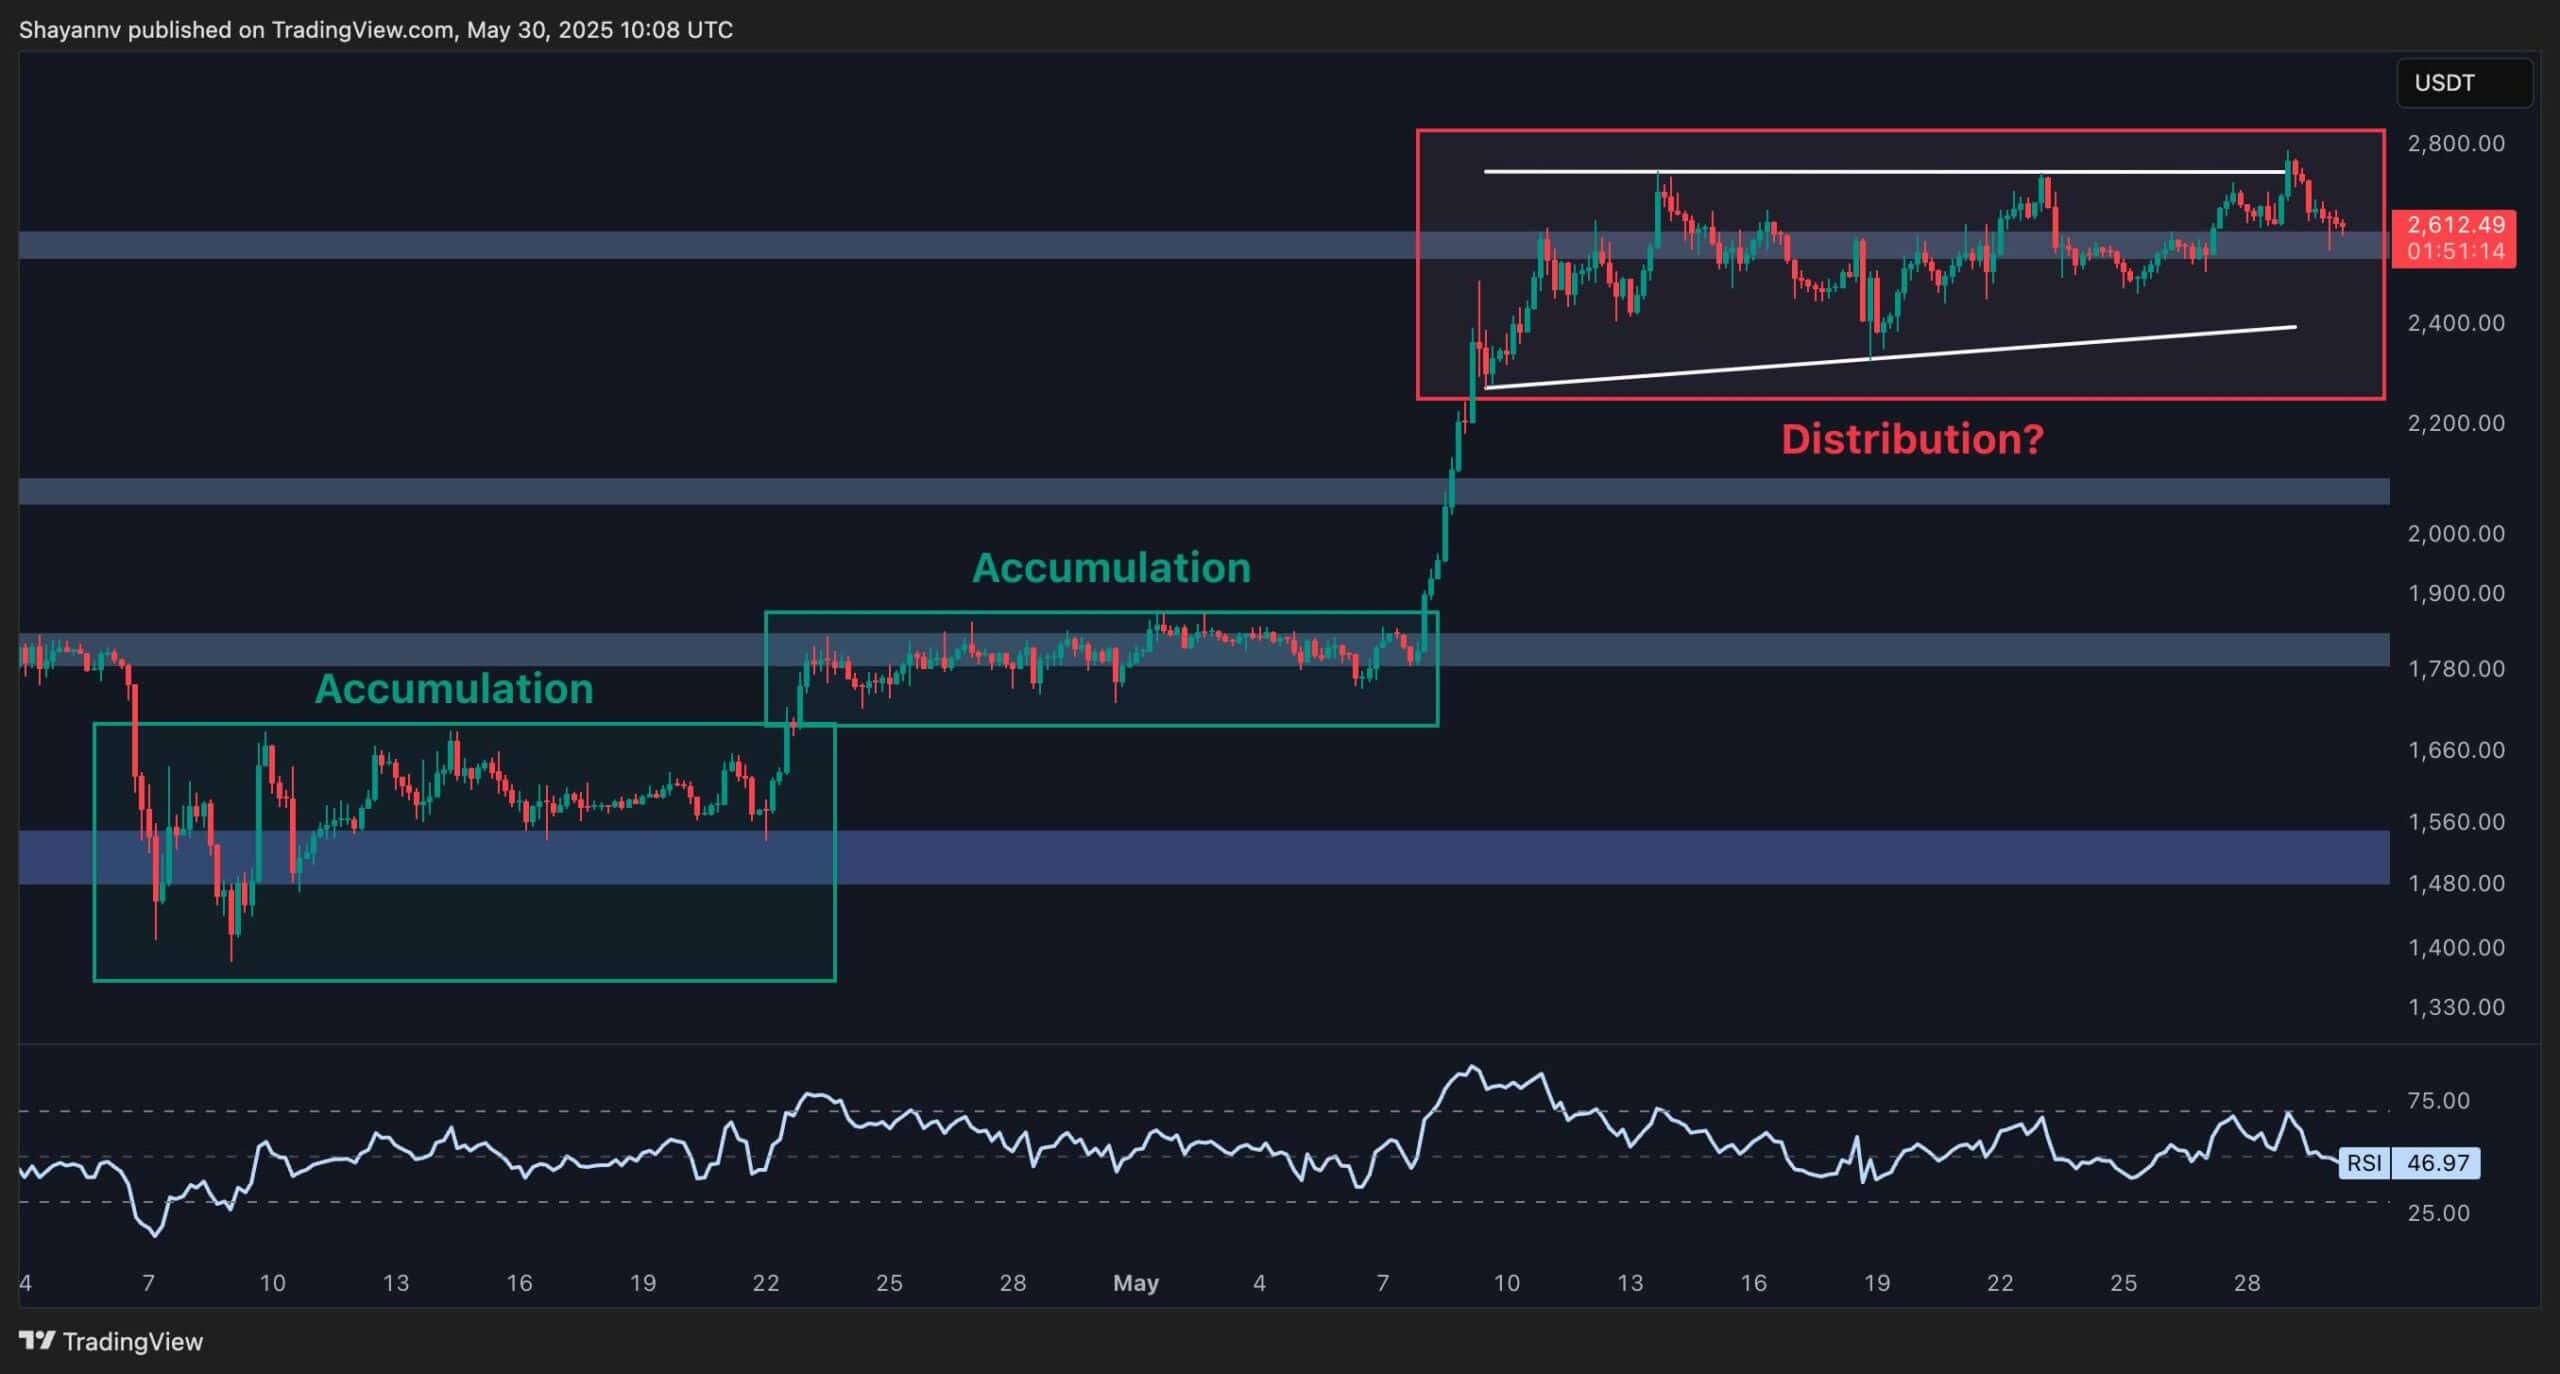
The 4-Hour Chart
The 4H chart shows that the price has formed a clear ascending triangle between the $2,800 resistance and roughly $2,500 support. The structure resembles a potential distribution phase following two strong accumulation zones below $1,850 earlier this month. While ETH continues to set higher lows, the repeated rejection at the highs is starting to weigh on the short-term outlook.
The RSI is also hovering near 47, suggesting a neutral momentum shift. A break below $2,500 and the lower boundary of the pattern would signal bearish reversal toward $2,100, while a confirmed breakout above $2,800 would invalidate the distribution idea and favor upside expansion.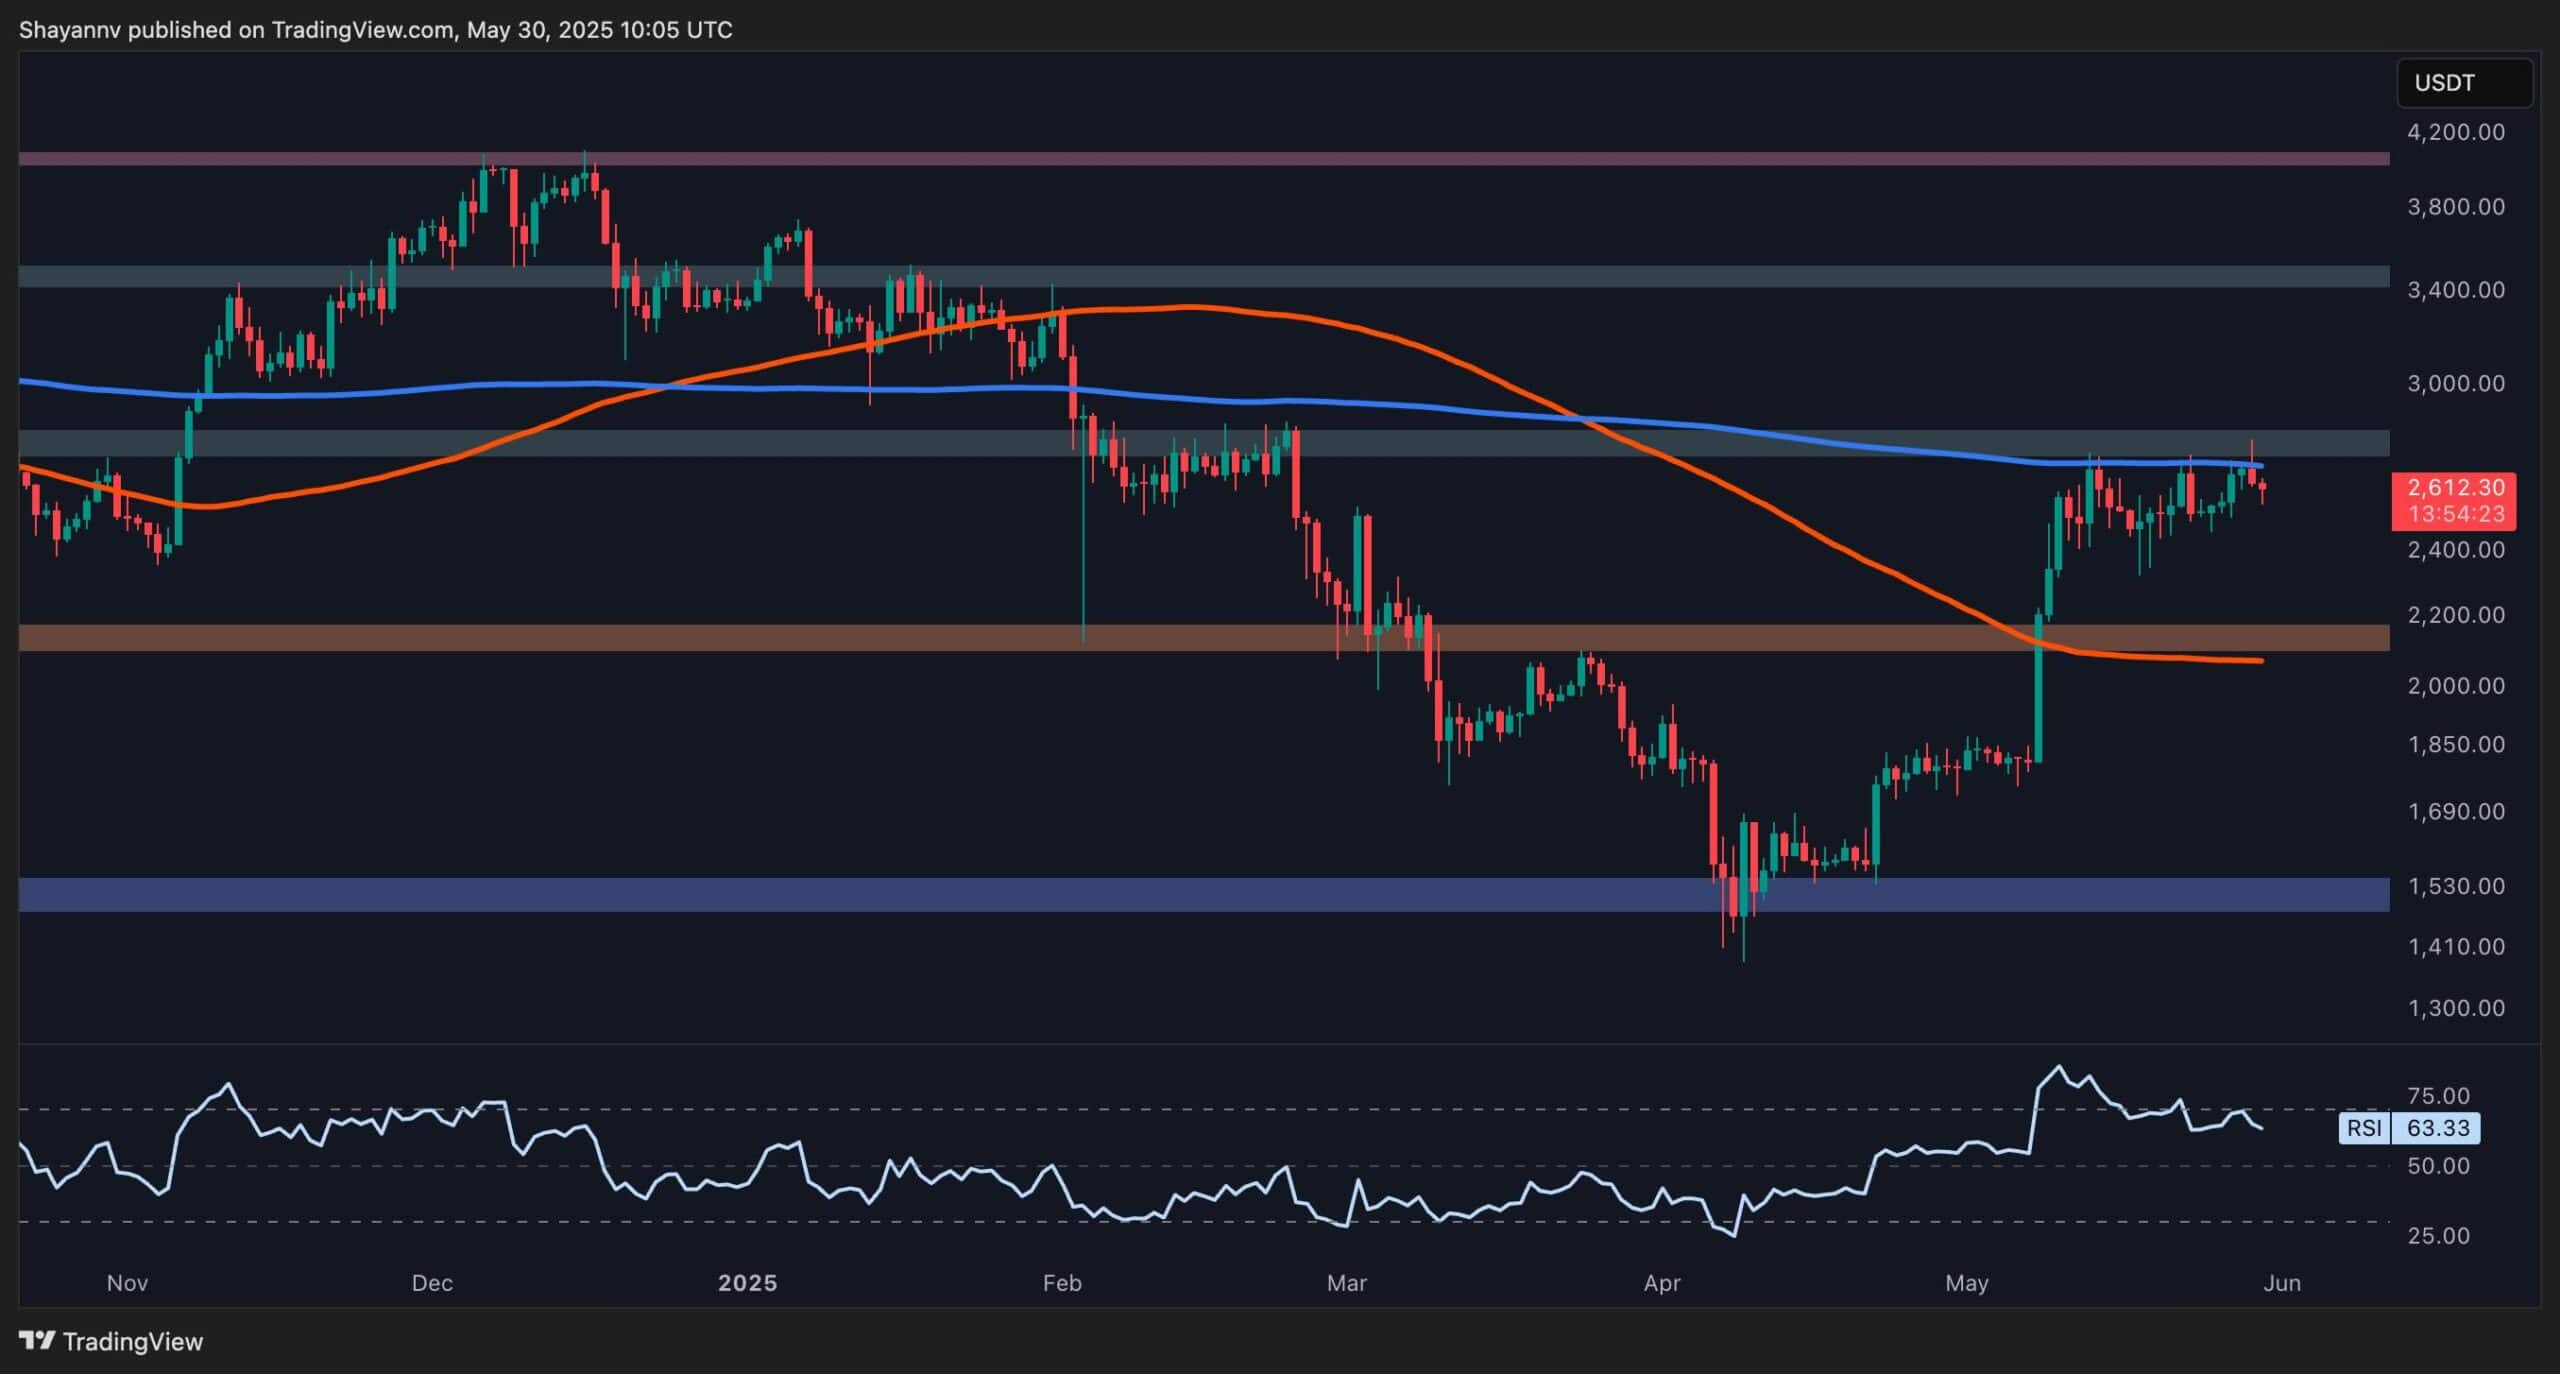
Sentiment Analysis
The Coinbase Premium Index is currently holding slightly above zero, indicating moderate spot demand from US-based investors. Historically, a rising premium has often preceded strong bullish trends driven by institutional or high-volume retail buyers on Coinbase. Although the current levels are not aggressively high, they reflect underlying strength in the spot market and a willingness to pay slightly more for ETH on U.S. exchanges.
If this premium begins expanding while ETH approaches resistance again, it could signal renewed confidence and front-running of a breakout. On the other hand, if the premium fades or turns negative, it may signal waning interest and a possible short-term top, which is the scenario that is seemingly occurring at the moment.
Therefore, if the demand from the US declines, it would be highly likely for ETH to go into a correction phase once more.
