Ethereum Teeters on the Brink: A Drop to $3.5K Looms if Critical Support Fails

Ethereum faces a pivotal moment as key technical levels threaten to give way. The entire market watches one number: $3.5K.
The Support Line in the Sand
Traders grip their seats as ETH tests a crucial price floor. Break this level, and analysts see a clear path downward. The next significant barrier sits squarely at the $3,500 mark—a psychological and technical battleground.
Market Mechanics at Play
Selling pressure mounts while buyers defend the line. Each candle on the chart tells a story of struggle. Volume patterns suggest big players are waiting on the sidelines, ready to pounce on a confirmed breakout—in either direction.
Broader Context Bites
Traditional finance pundits—who still think blockchain is a type of ski binding—chuckle from the sidelines. Meanwhile, crypto natives know this dance well: brutal corrections often precede historic runs. The smart money watches for accumulation signals near these levels.
Ethereum's infrastructure continues evolving regardless of short-term price action. The network hums along, processing transactions and settling smart contracts while traders sweat over charts. Sometimes the tech moves faster than the token value—a frustrating reality for investors seeking quick gains.
Will support hold or fold? The market votes with every trade. One thing's certain: volatility never takes a day off in crypto land.
Technical Analysis
By Shayan
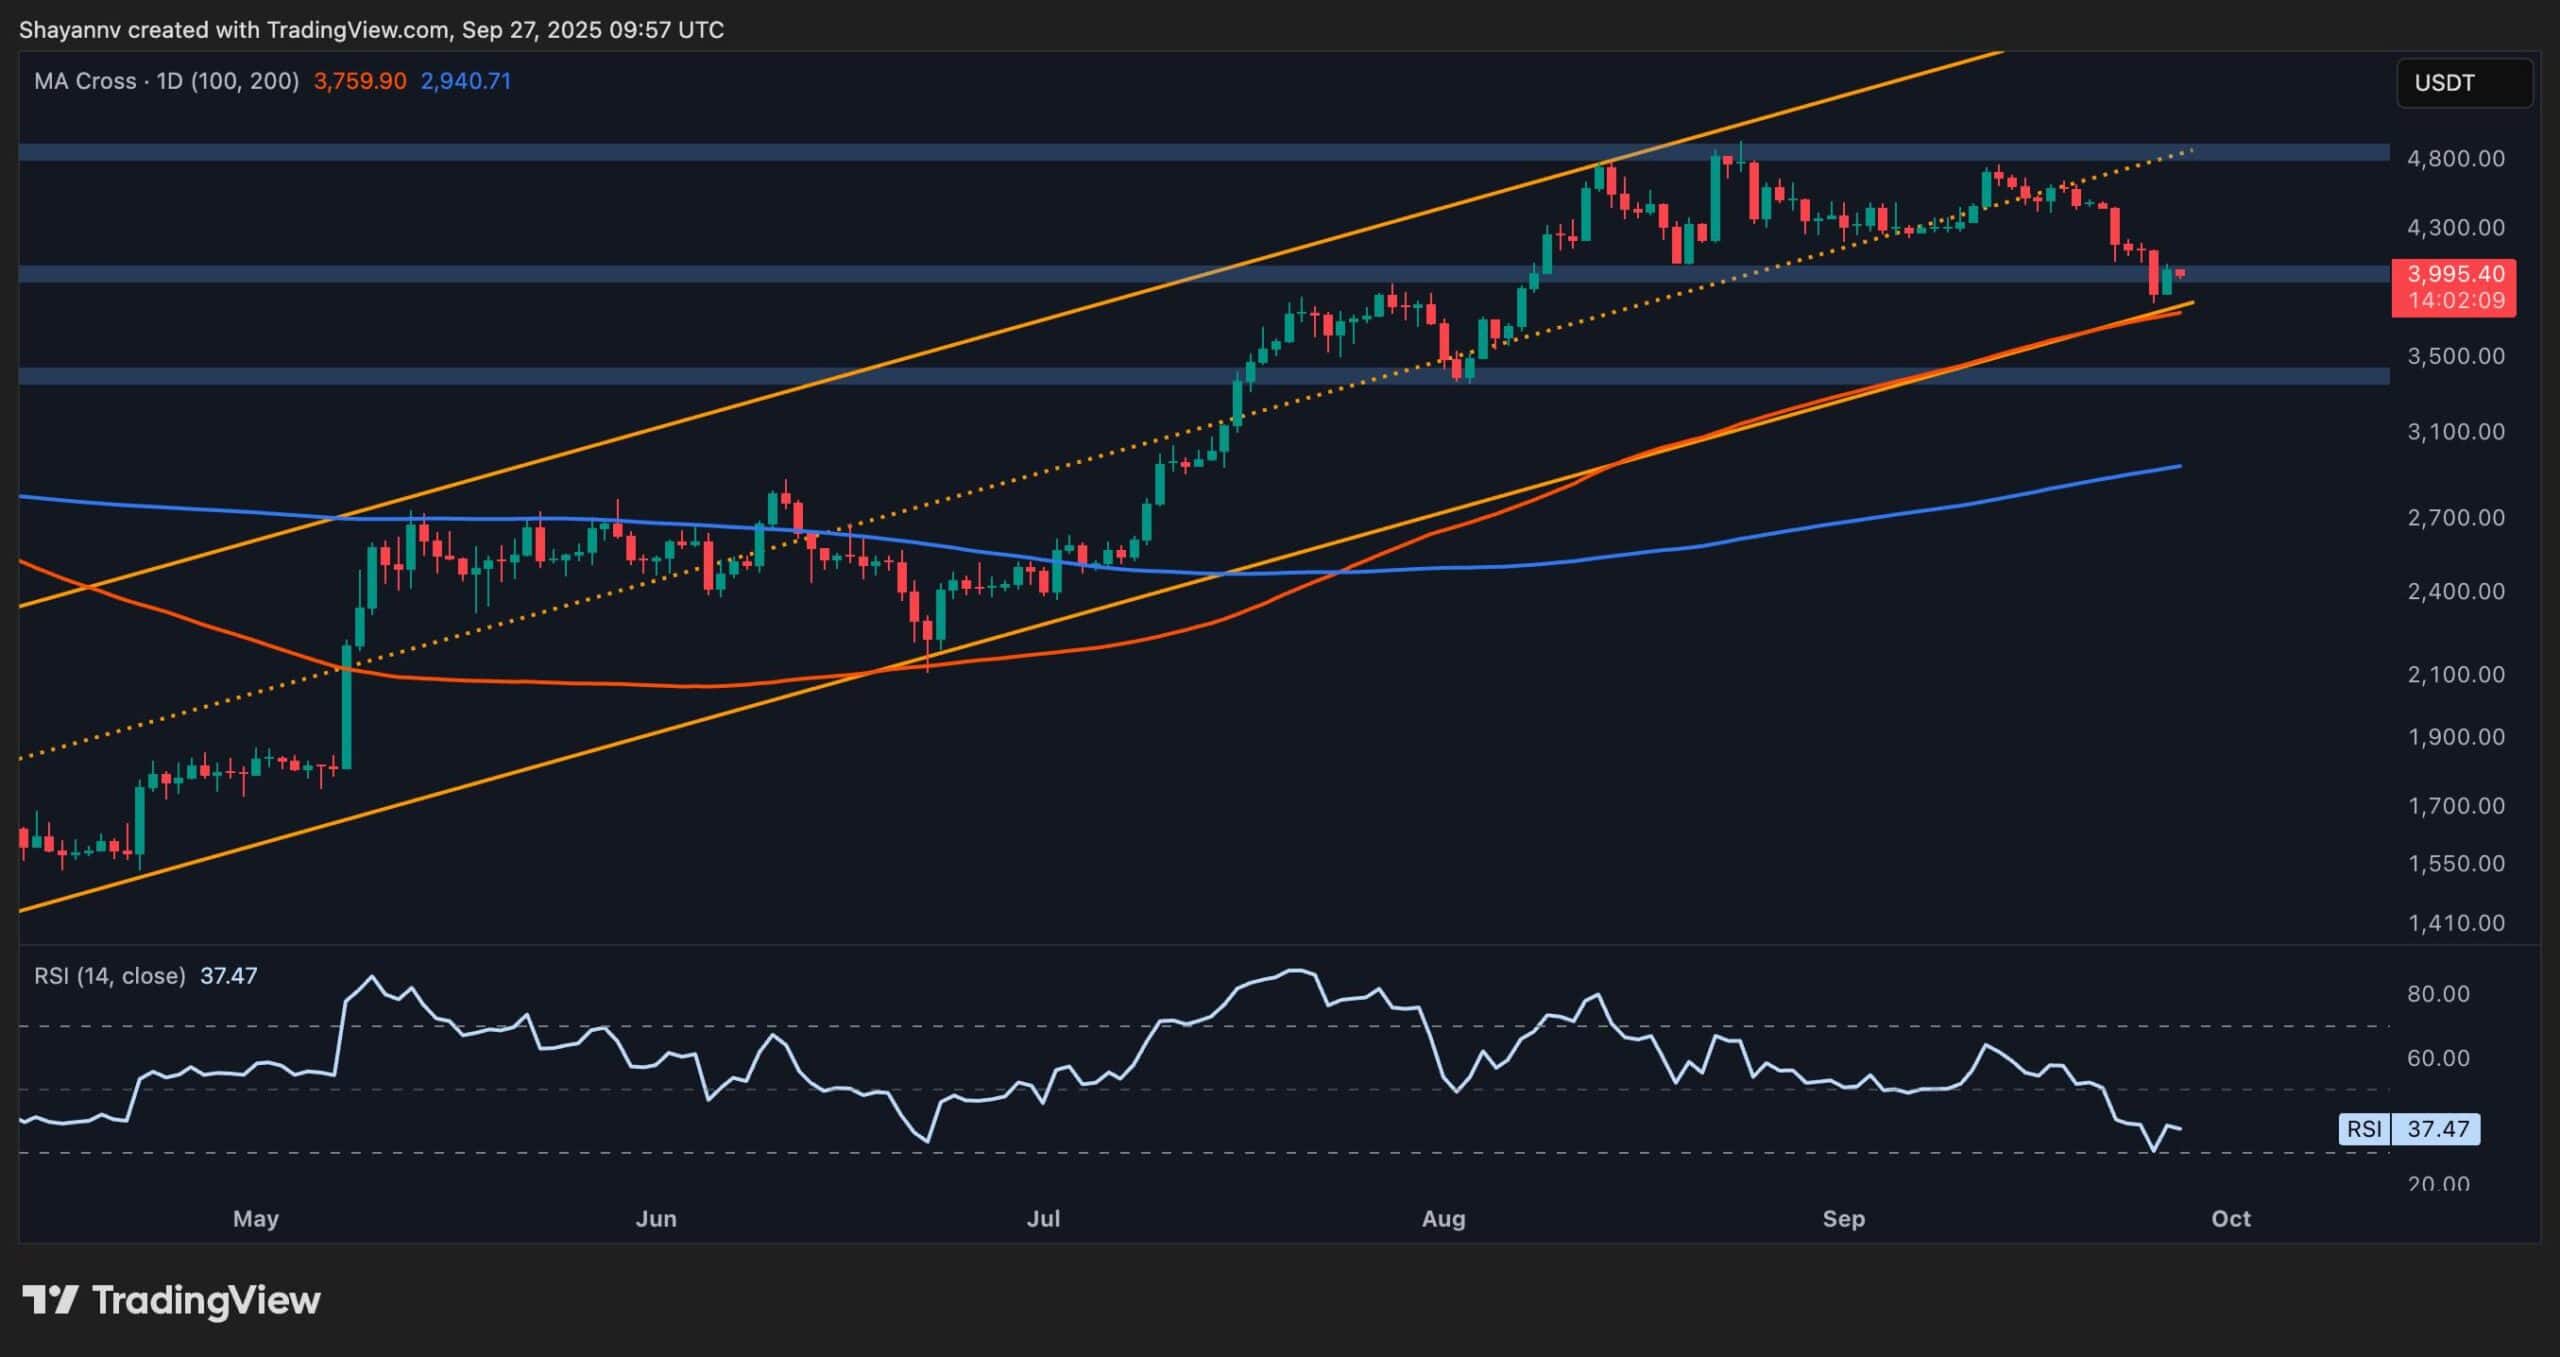
The Daily Chart
On the daily chart, ETH has lost the midline of its ascending channel, breaking below the dotted trendline that had supported the price since August. The asset is now testing the $4,000 key level, which aligns closely with the lower boundary of the channel and the 100-day moving average located around the $3,800 level.
The RSI has also dipped near the oversold region but has rebounded slightly and is now hovering around 40, hinting at a possible local bottom if buyers step in with volume. However, if the asset breaks below the $4,000 level, a deeper drop toward the $3.5K range could be expected, which WOULD officially put the market in a downtrend situation.
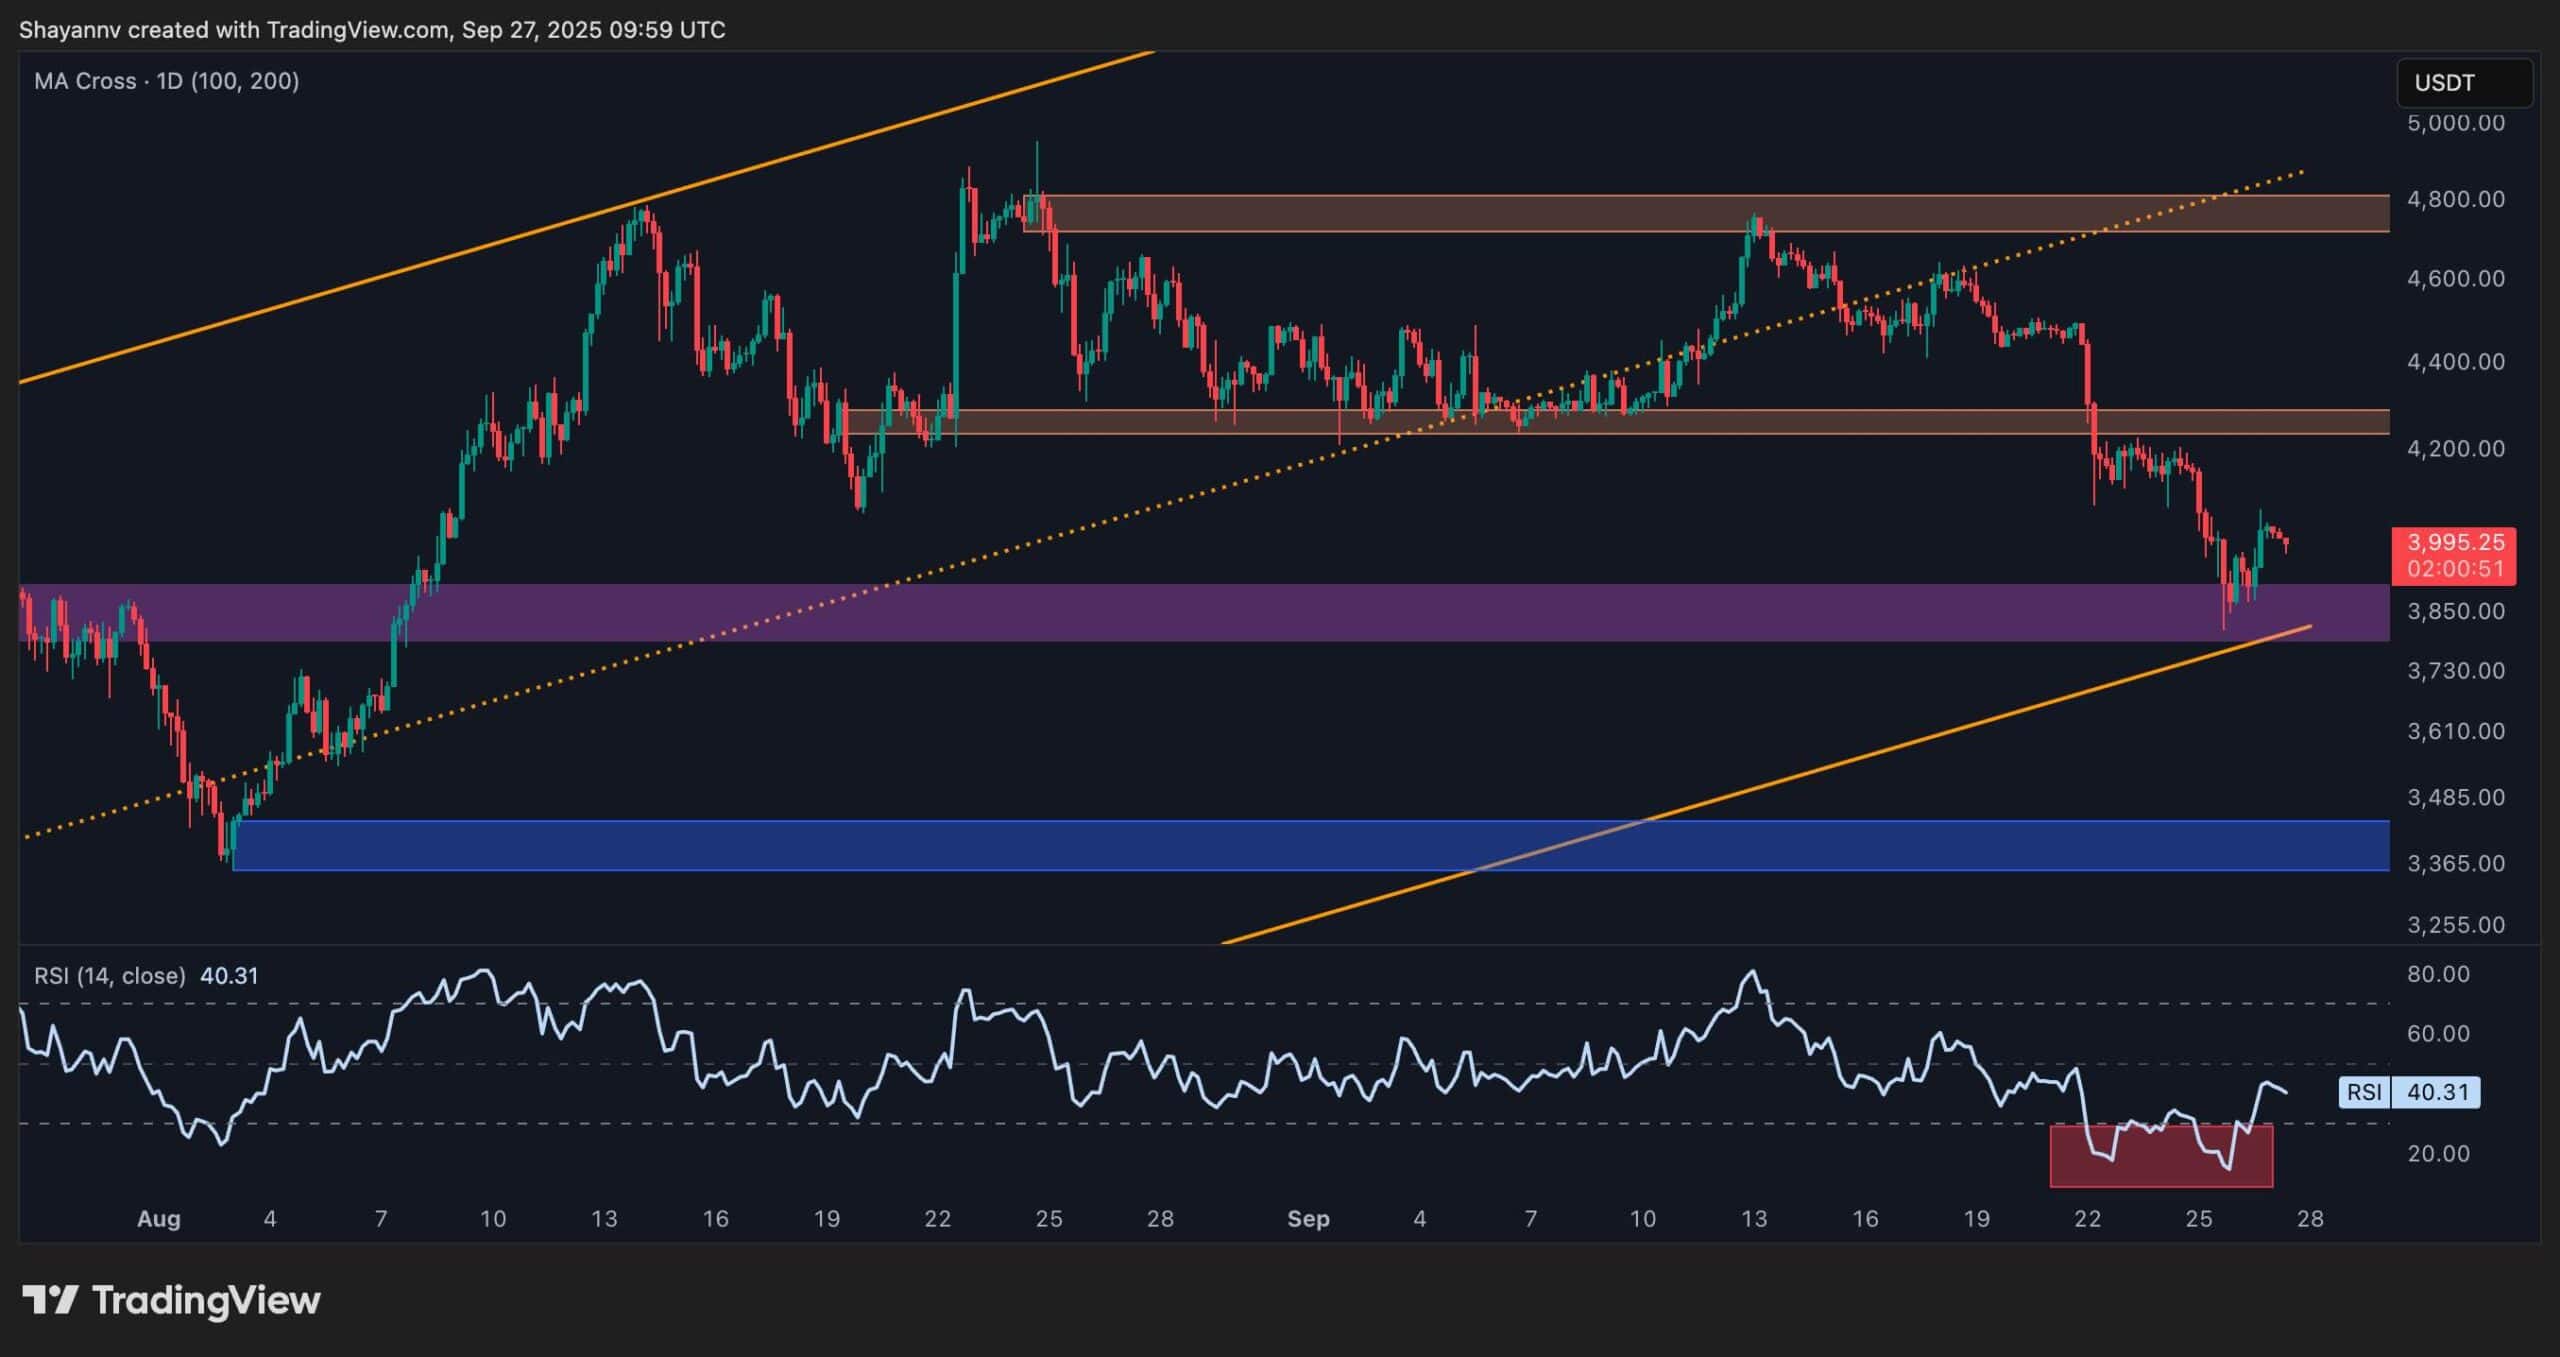
The 4-Hour Chart
On the 4-hour chart, ETH shows signs of a short-term rebound after reaching the purple demand zone around $3,850. The price bounced quite sharply from this zone and is now consolidating just below $4K. This MOVE forms a potential short-term bottom, especially since RSI has exited oversold territory and is now trending up.
That said, the structure remains bearish as long as ETH stays below $4,200 level. If buyers can reclaim that level, momentum could shift back in favor of a bullish move. Otherwise, a drop toward the $3,500 area would be very probable in the coming weeks.
Onchain Analysis
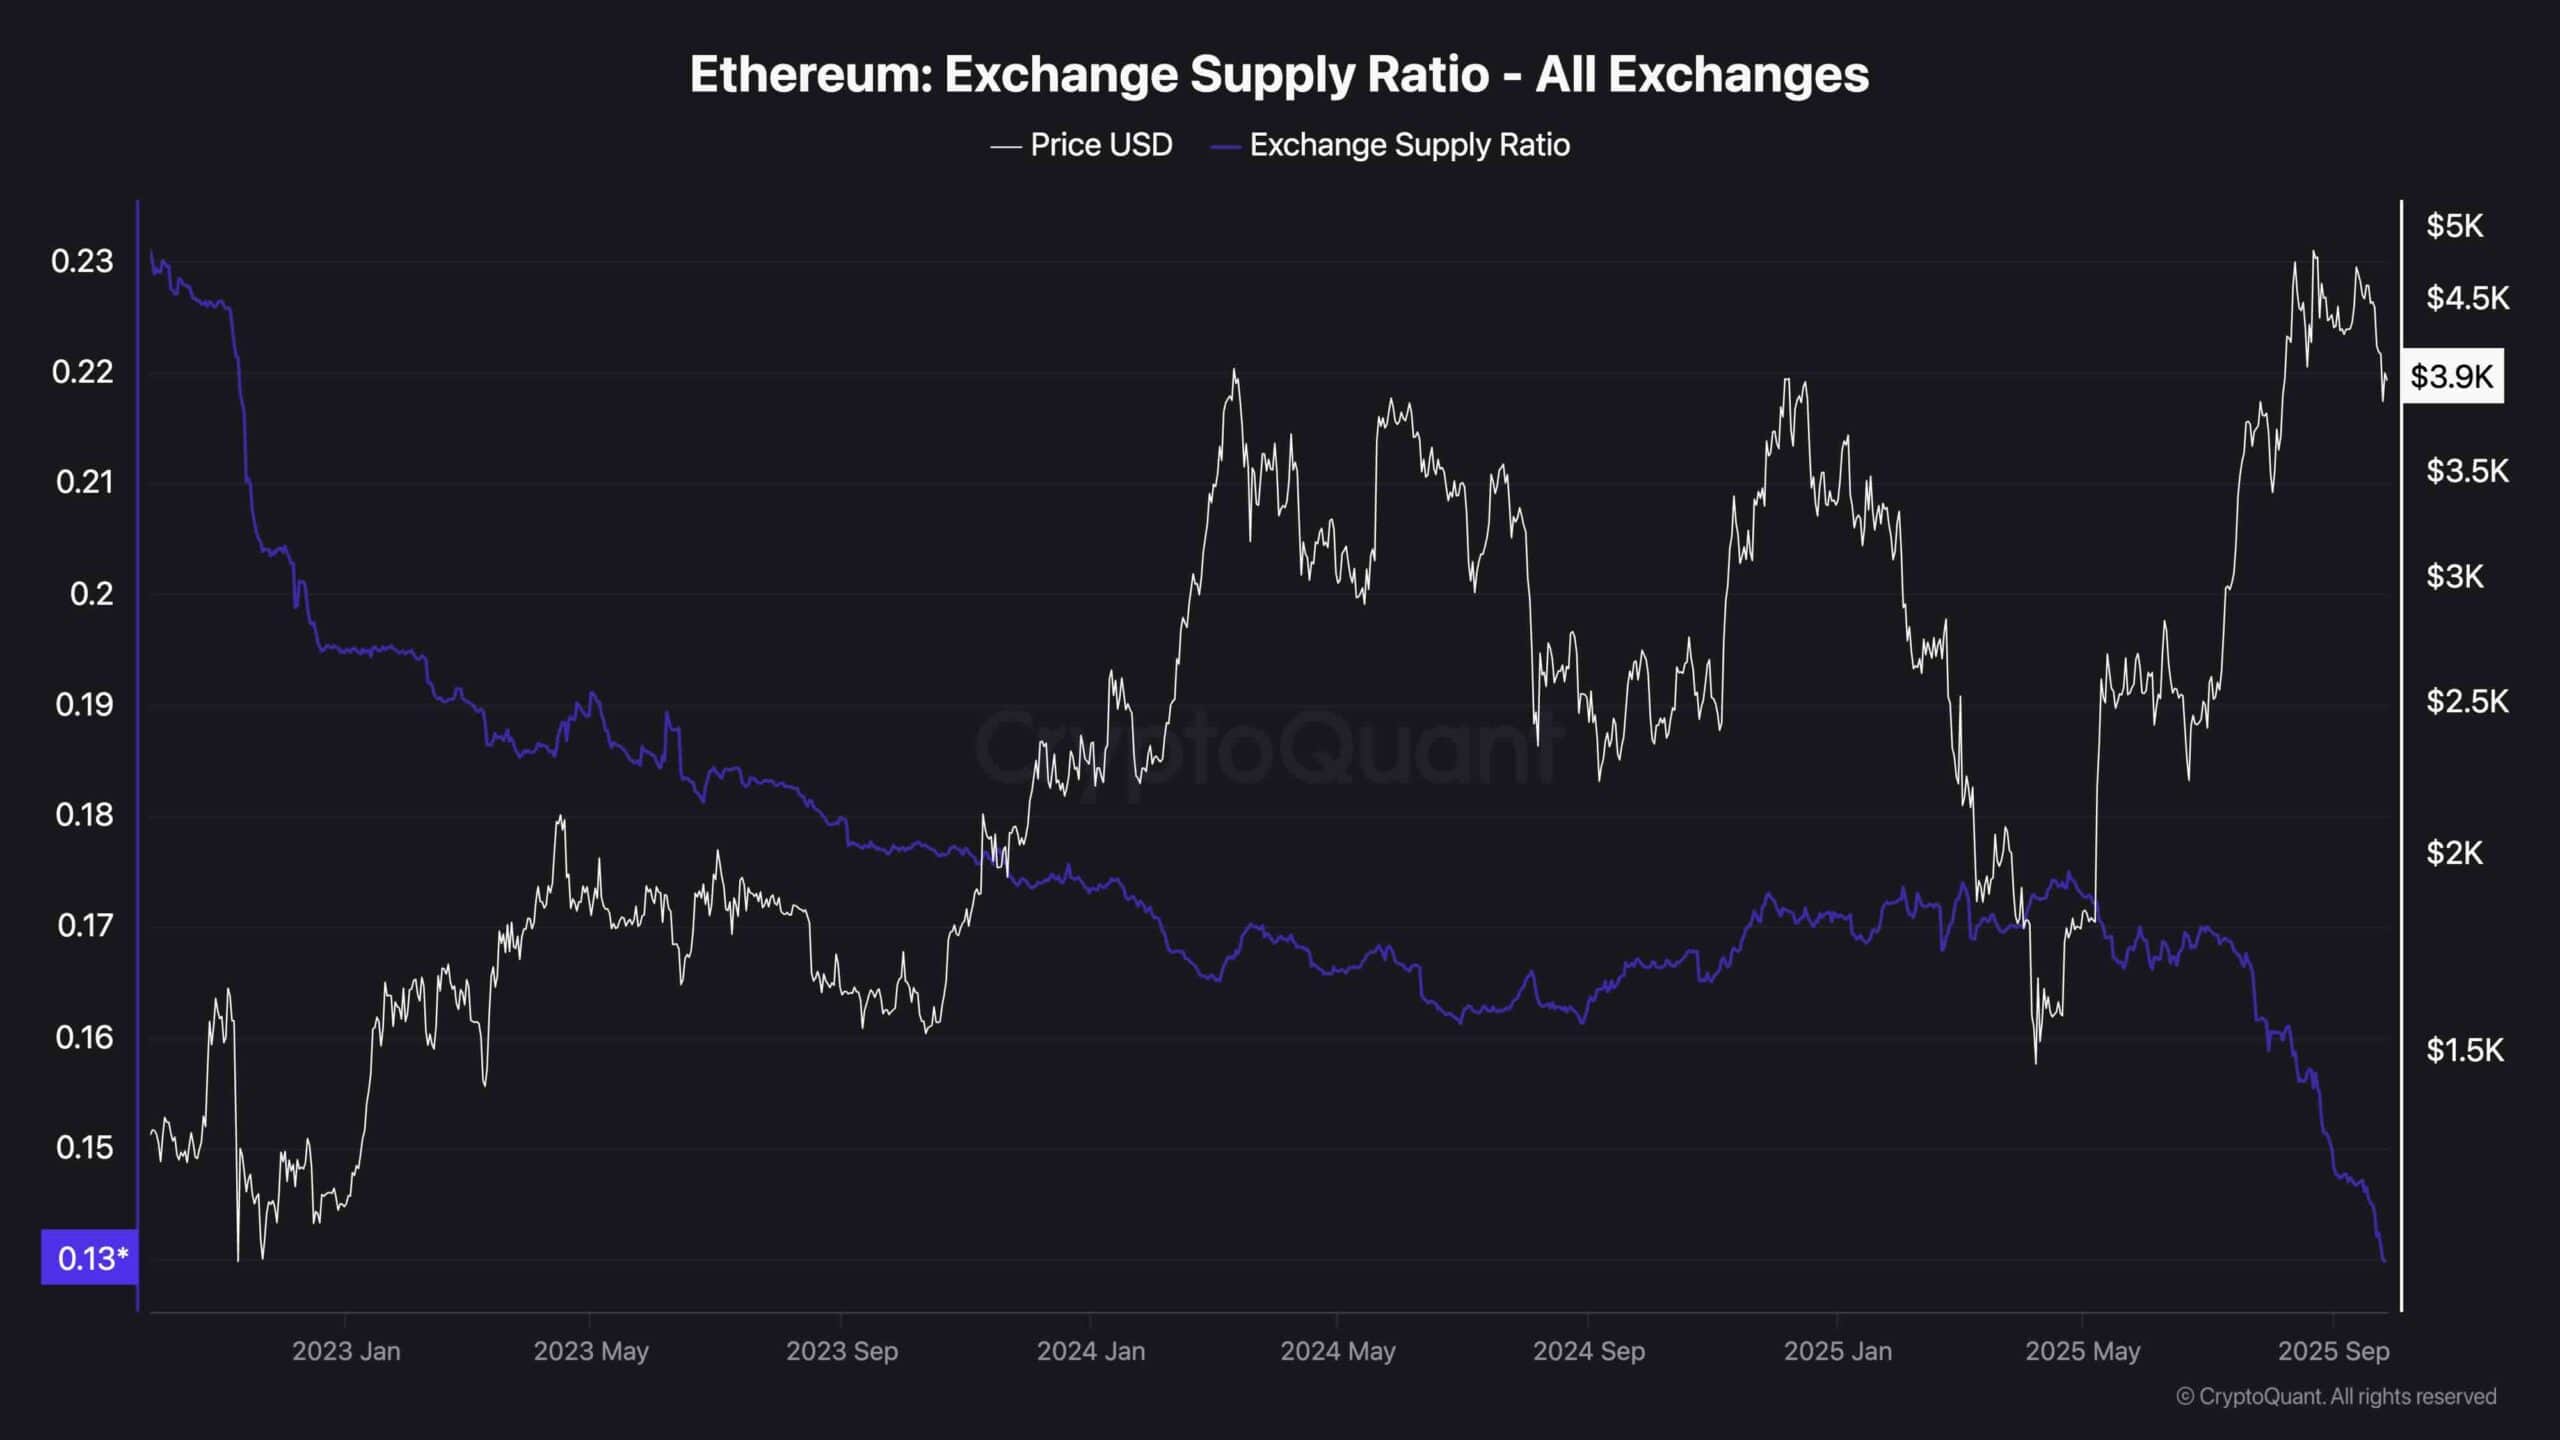
Exchange Supply Ratio
On the on-chain data front, Ethereum’s Exchange Supply Ratio continues to trend downward, now sitting at its lowest point in years, NEAR 0.13. This shows that a declining portion of the total ETH supply is held on centralized exchanges, suggesting a strong long-term accumulation trend. Historically, this has been a bullish signal, as it means fewer tokens are readily available for selling.
However, this accumulation trend contrasts with the recent price action. While fewer ETH are sitting on exchanges, the price still dropped sharply, possibly due to short-term leverage wipeouts or broader market sentiment. In any case, this metric supports the idea that long-term holders remain confident, and unless we see a sudden reversal in exchange inflows, the macro bullish structure stays intact.