Bitcoin Plunges Below Critical Support: Where Does BTC Go From Here?

Bitcoin just sliced through its most important technical level—and the fallout could reshape the entire crypto landscape.
The Breakdown Moment
BTC's price action defied bullish expectations, collapsing below the support zone that traders had watched for weeks. Market sentiment flipped from cautious optimism to outright bearish territory in mere hours.
Technical Damage Assessment
The breakdown triggers classic chart patterns suggesting further downside potential. Resistance levels that once served as floors now loom overhead like concrete ceilings. Trading volume spiked during the decline—confirming genuine selling pressure rather than mere market noise.
Institutional Reaction
Whale wallets remain curiously inactive during the plunge. Either major holders see this as temporary volatility, or they're waiting for even lower entry points. Meanwhile, derivatives markets show escalating fear with put/call ratios hitting extremes not seen since last quarter's correction.
The Path Forward
Next support zones sit significantly lower, but history shows Bitcoin often finds its footing where maximum pain meets maximum opportunity. The very traders now predicting $20K Bitcoin will likely FOMO back in at $40K—because Wall Street's memory lasts about as long as a TikTok video.
Technical Analysis
By Shayan
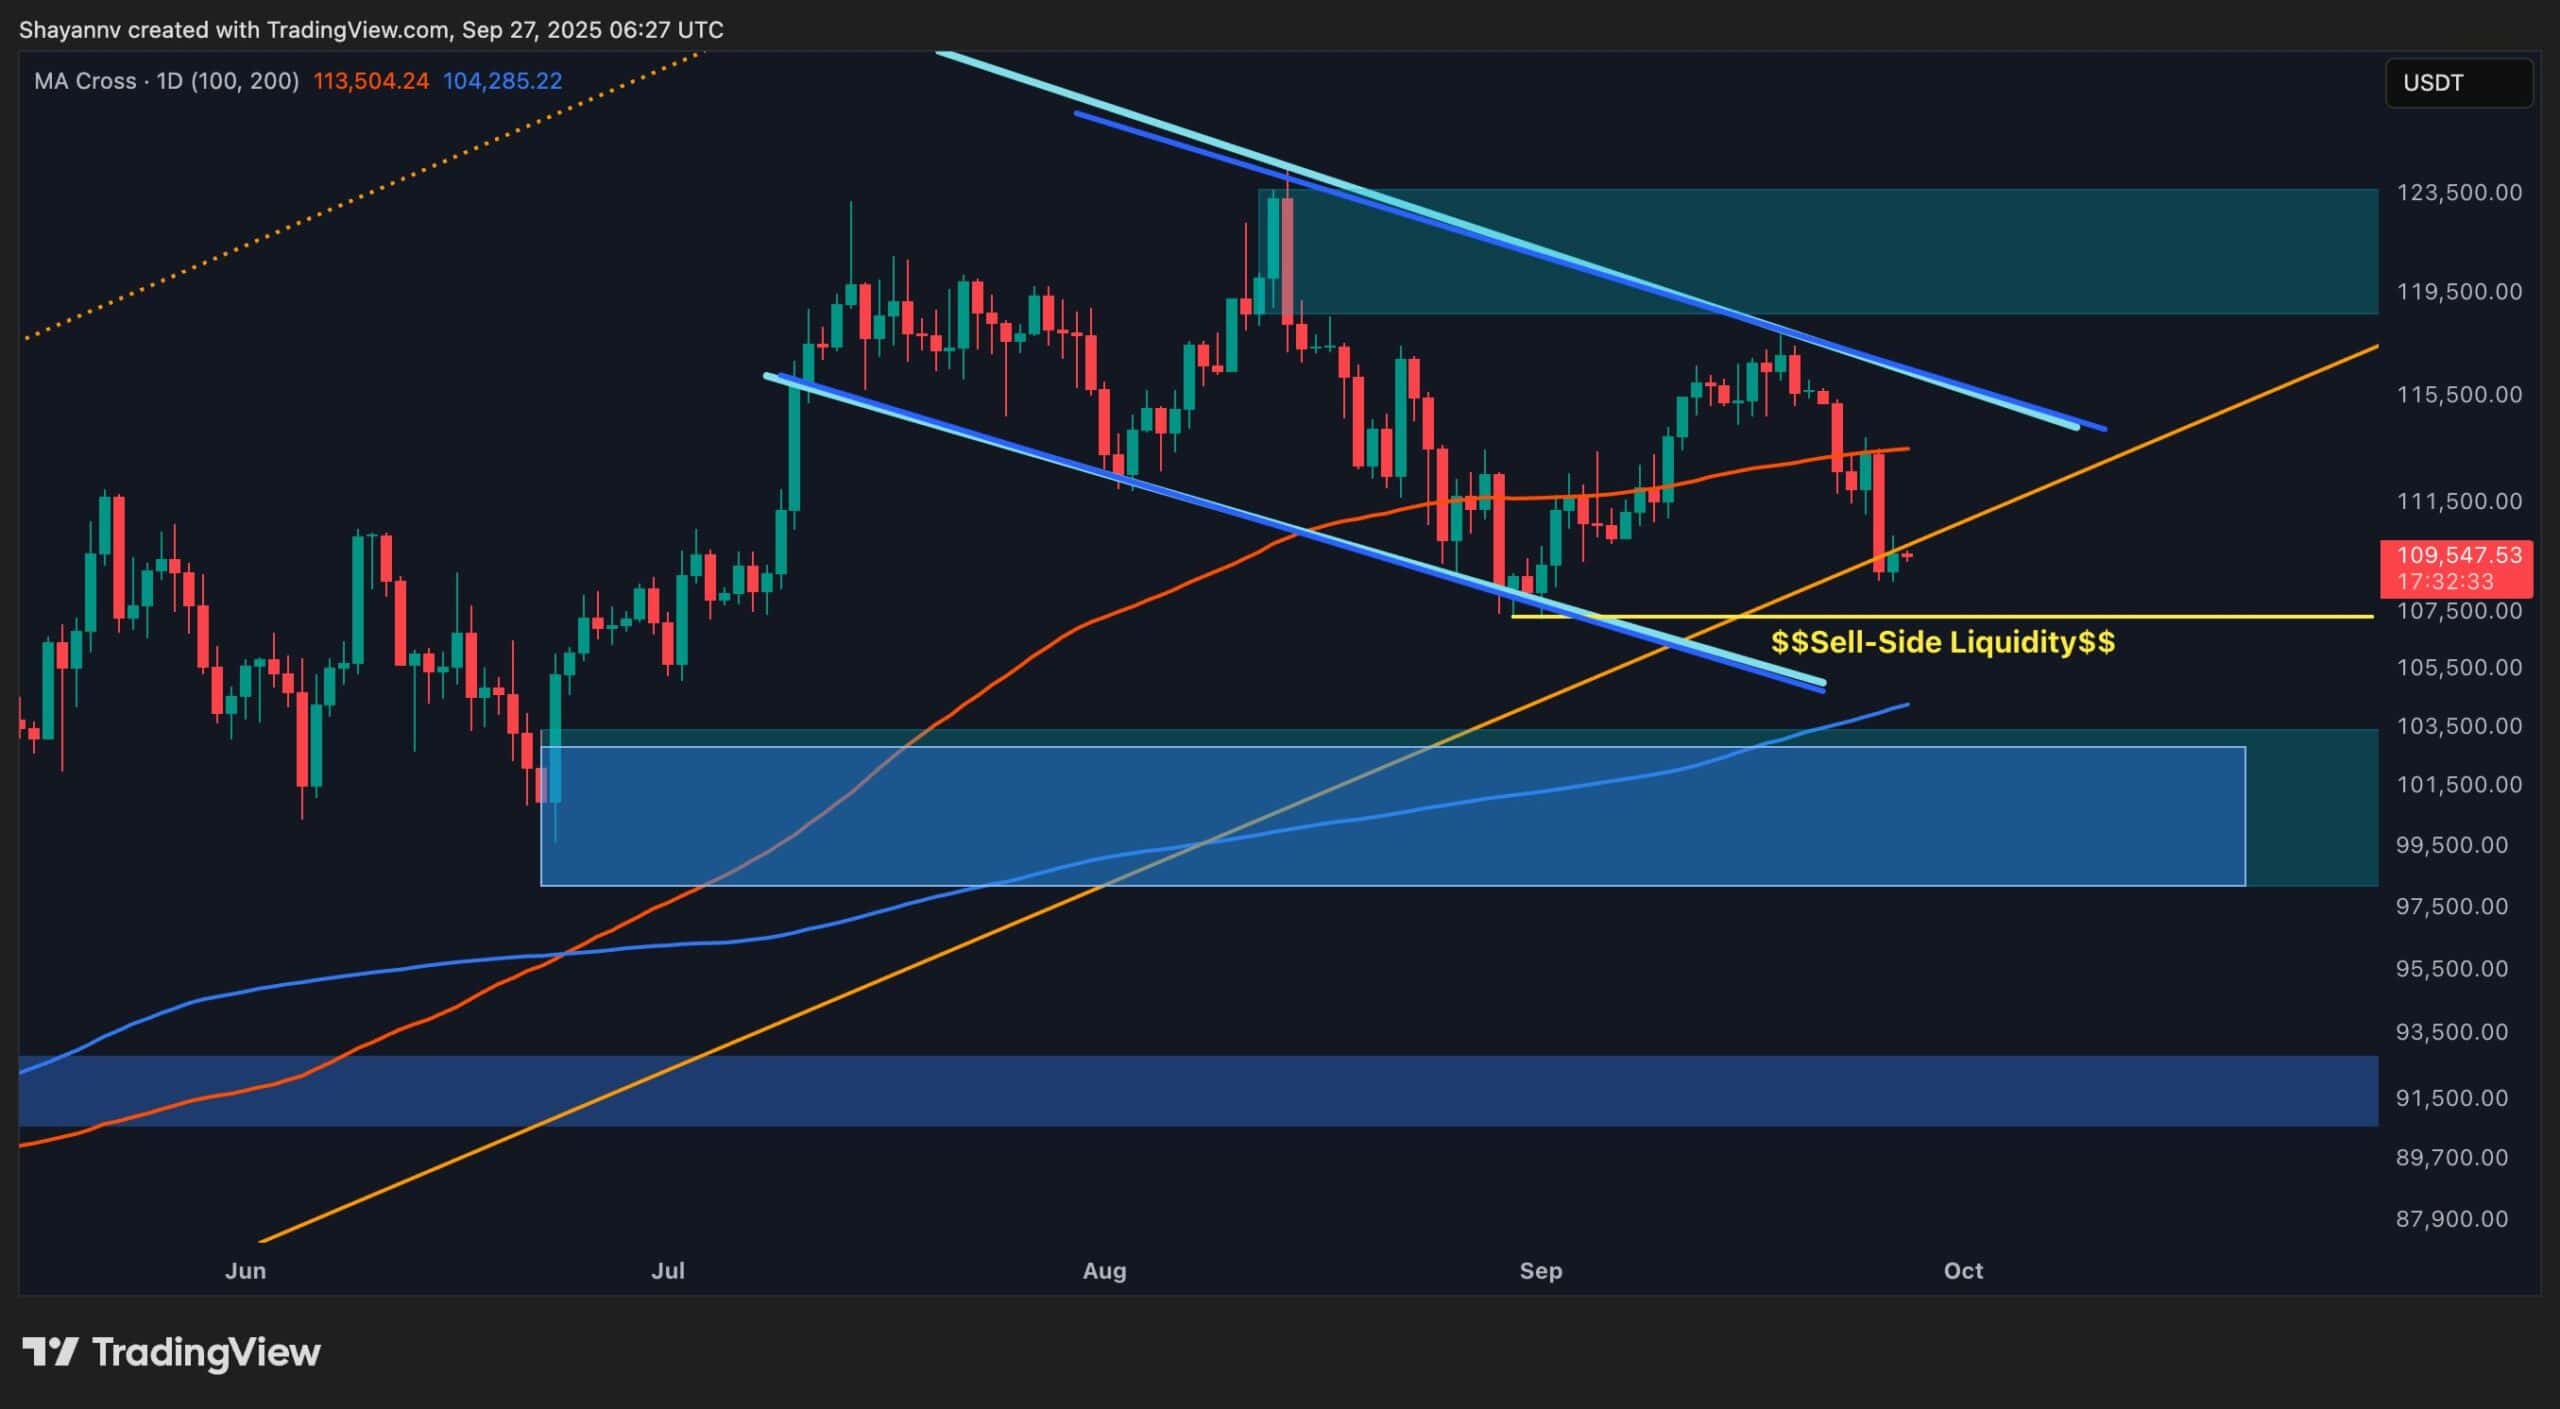
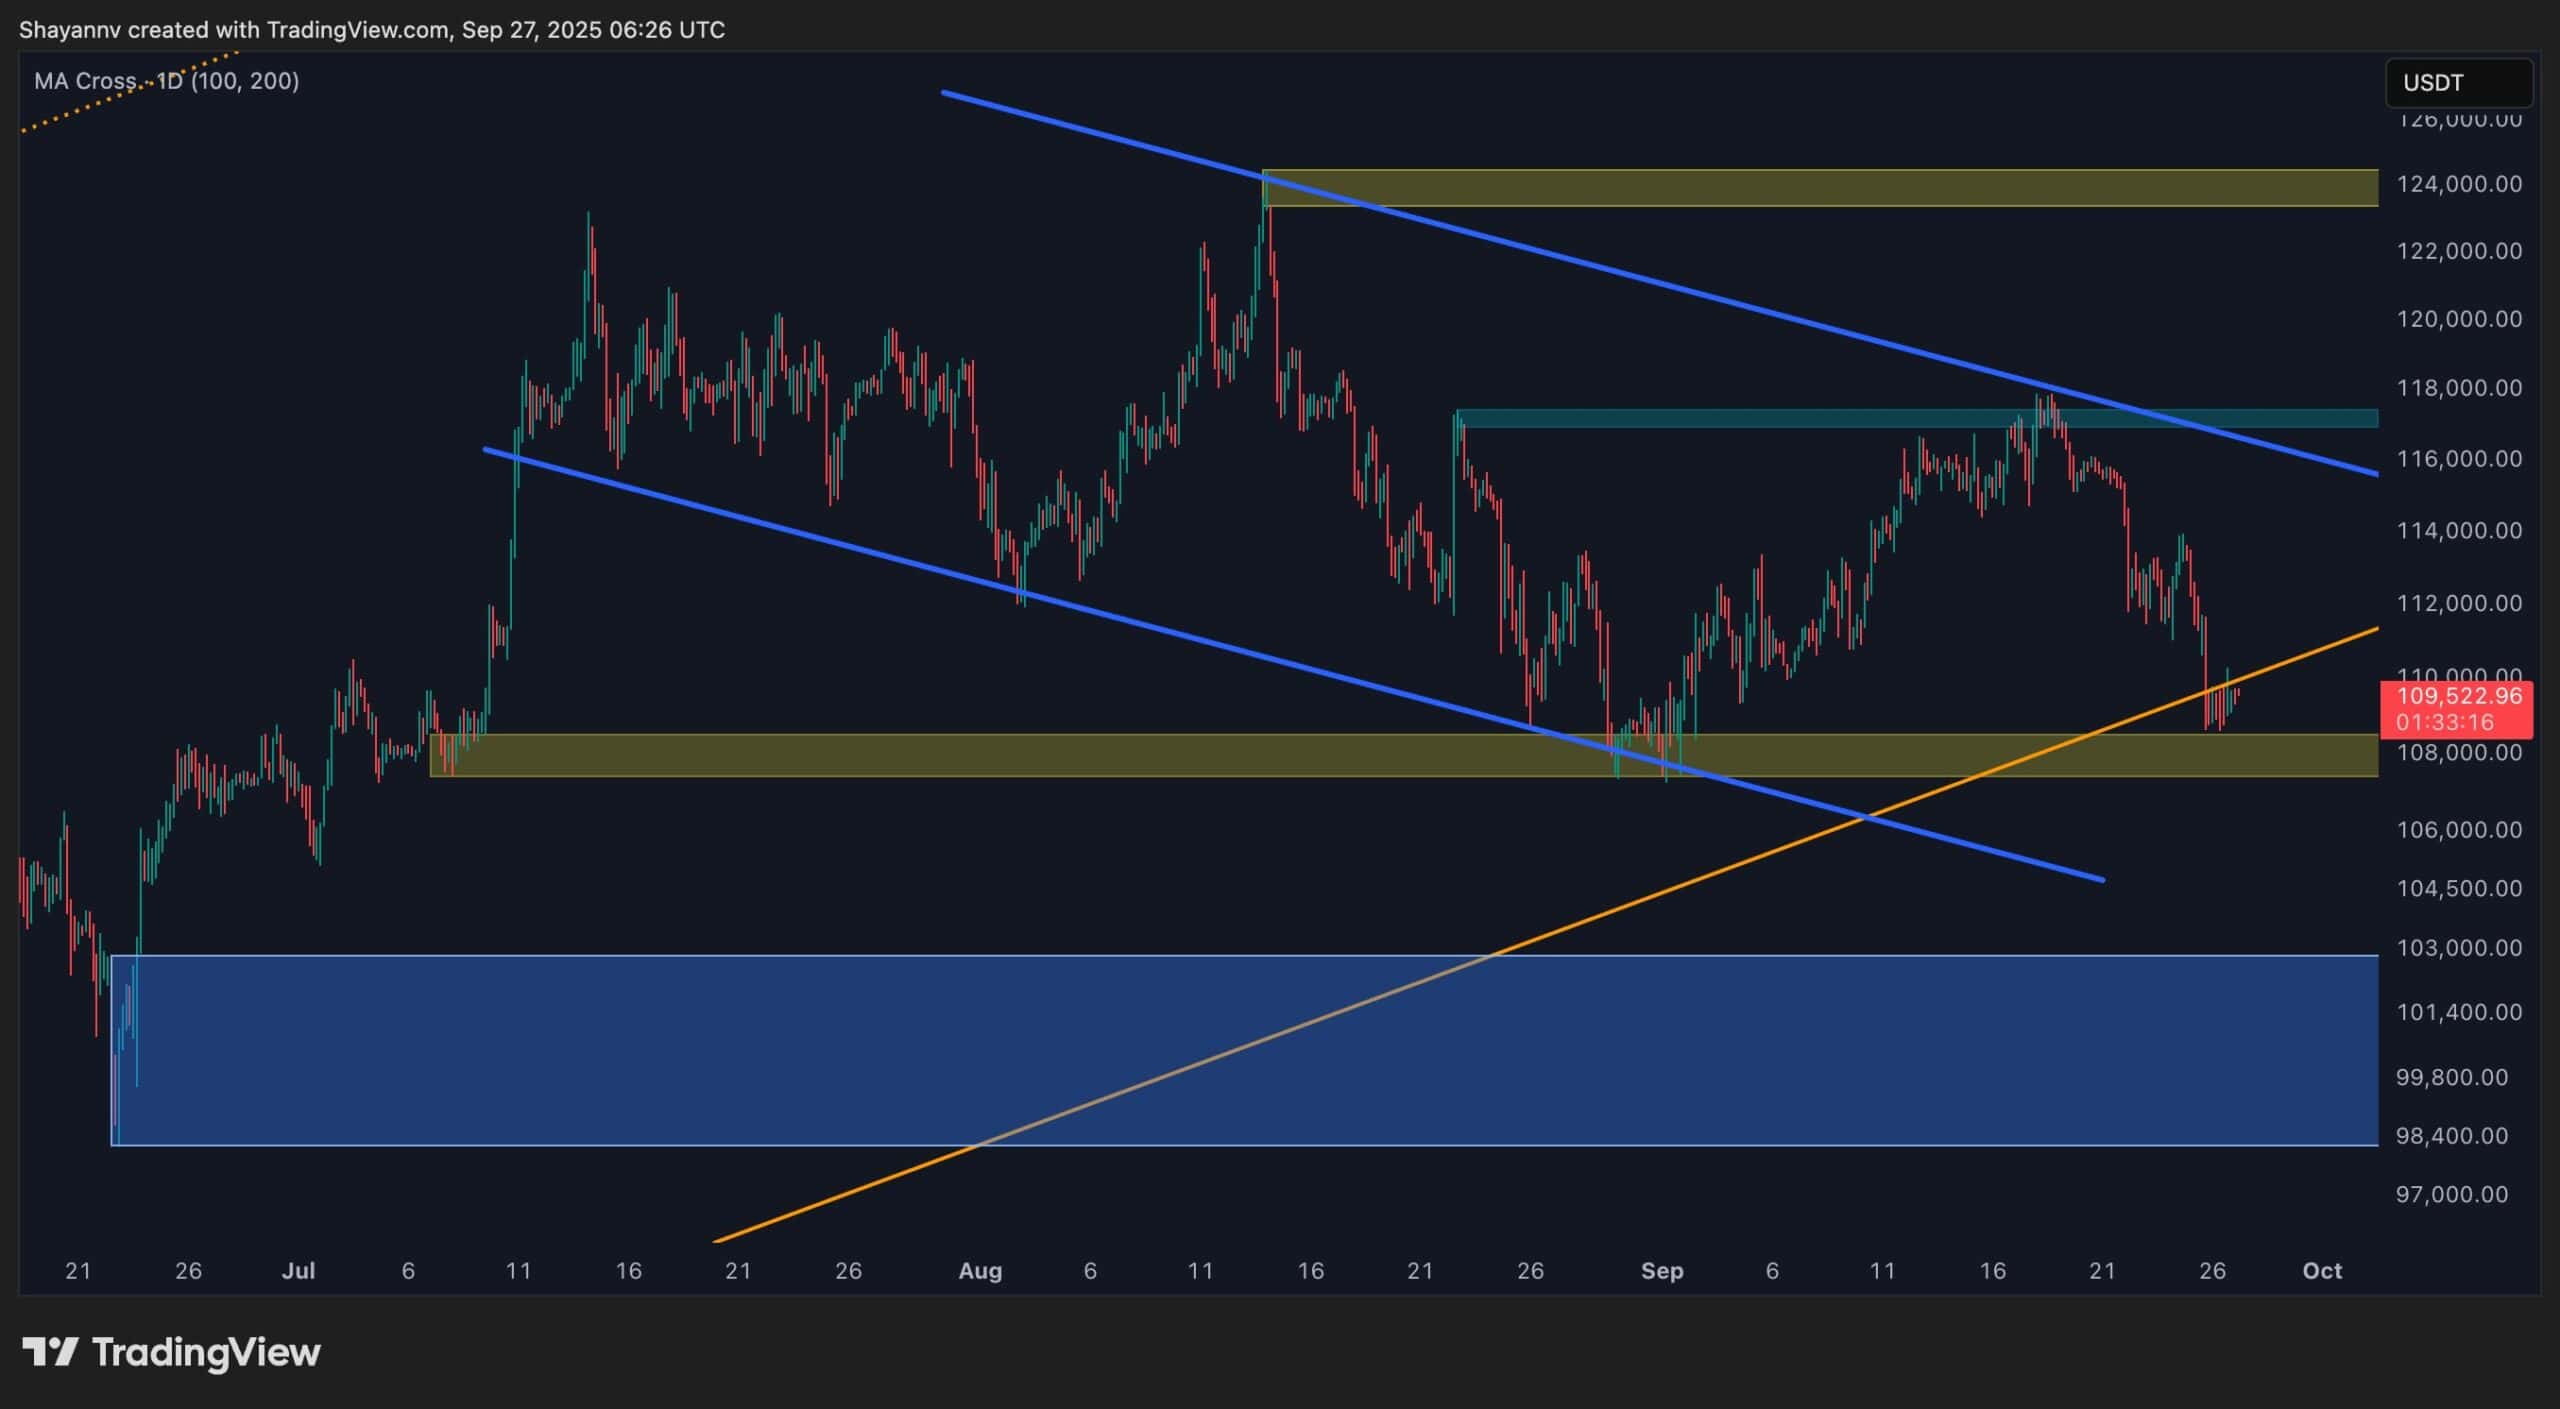
The Daily Chart
On the daily timeframe, Bitcoin has dropped beneath the 100-day MA, leaving the price caught between the 100-day ($113K) and 200-day ($104K) moving averages. This range often acts as a “no man’s land,” reflecting indecision until either buyers or sellers reclaim momentum.
The descending channel structure remains intact, suggesting persistent downward pressure unless bulls can defend the channel’s lower boundary NEAR $109K. Holding above this region is essential to prevent deeper tests toward the 200-day MA and the $100K–$102K demand zone.
Notably, there is a visible sell-side liquidity pocket below $107K, which could draw the price lower in a liquidity sweep before any major reversal attempt unfolds.
The 4-Hour Chart
On the 4-hour timeframe, bitcoin was rejected aggressively from $117K, triggering a cascade of selling. The decline has brought the price into a bullish flag structure, with BTC now hovering just above a key demand zone below $110K.
This area is vital for preserving bullish potential. If buyers defend it successfully, Bitcoin could stage a rebound toward recent highs. However, a breakdown here WOULD likely accelerate the move toward the deeper liquidity pool near $100K, aligning with the 200-day MA. The next leg will depend on whether demand can withstand continued sell pressure or if sellers push the market into fresh lows.
Sentiment Analysis
By Shayan
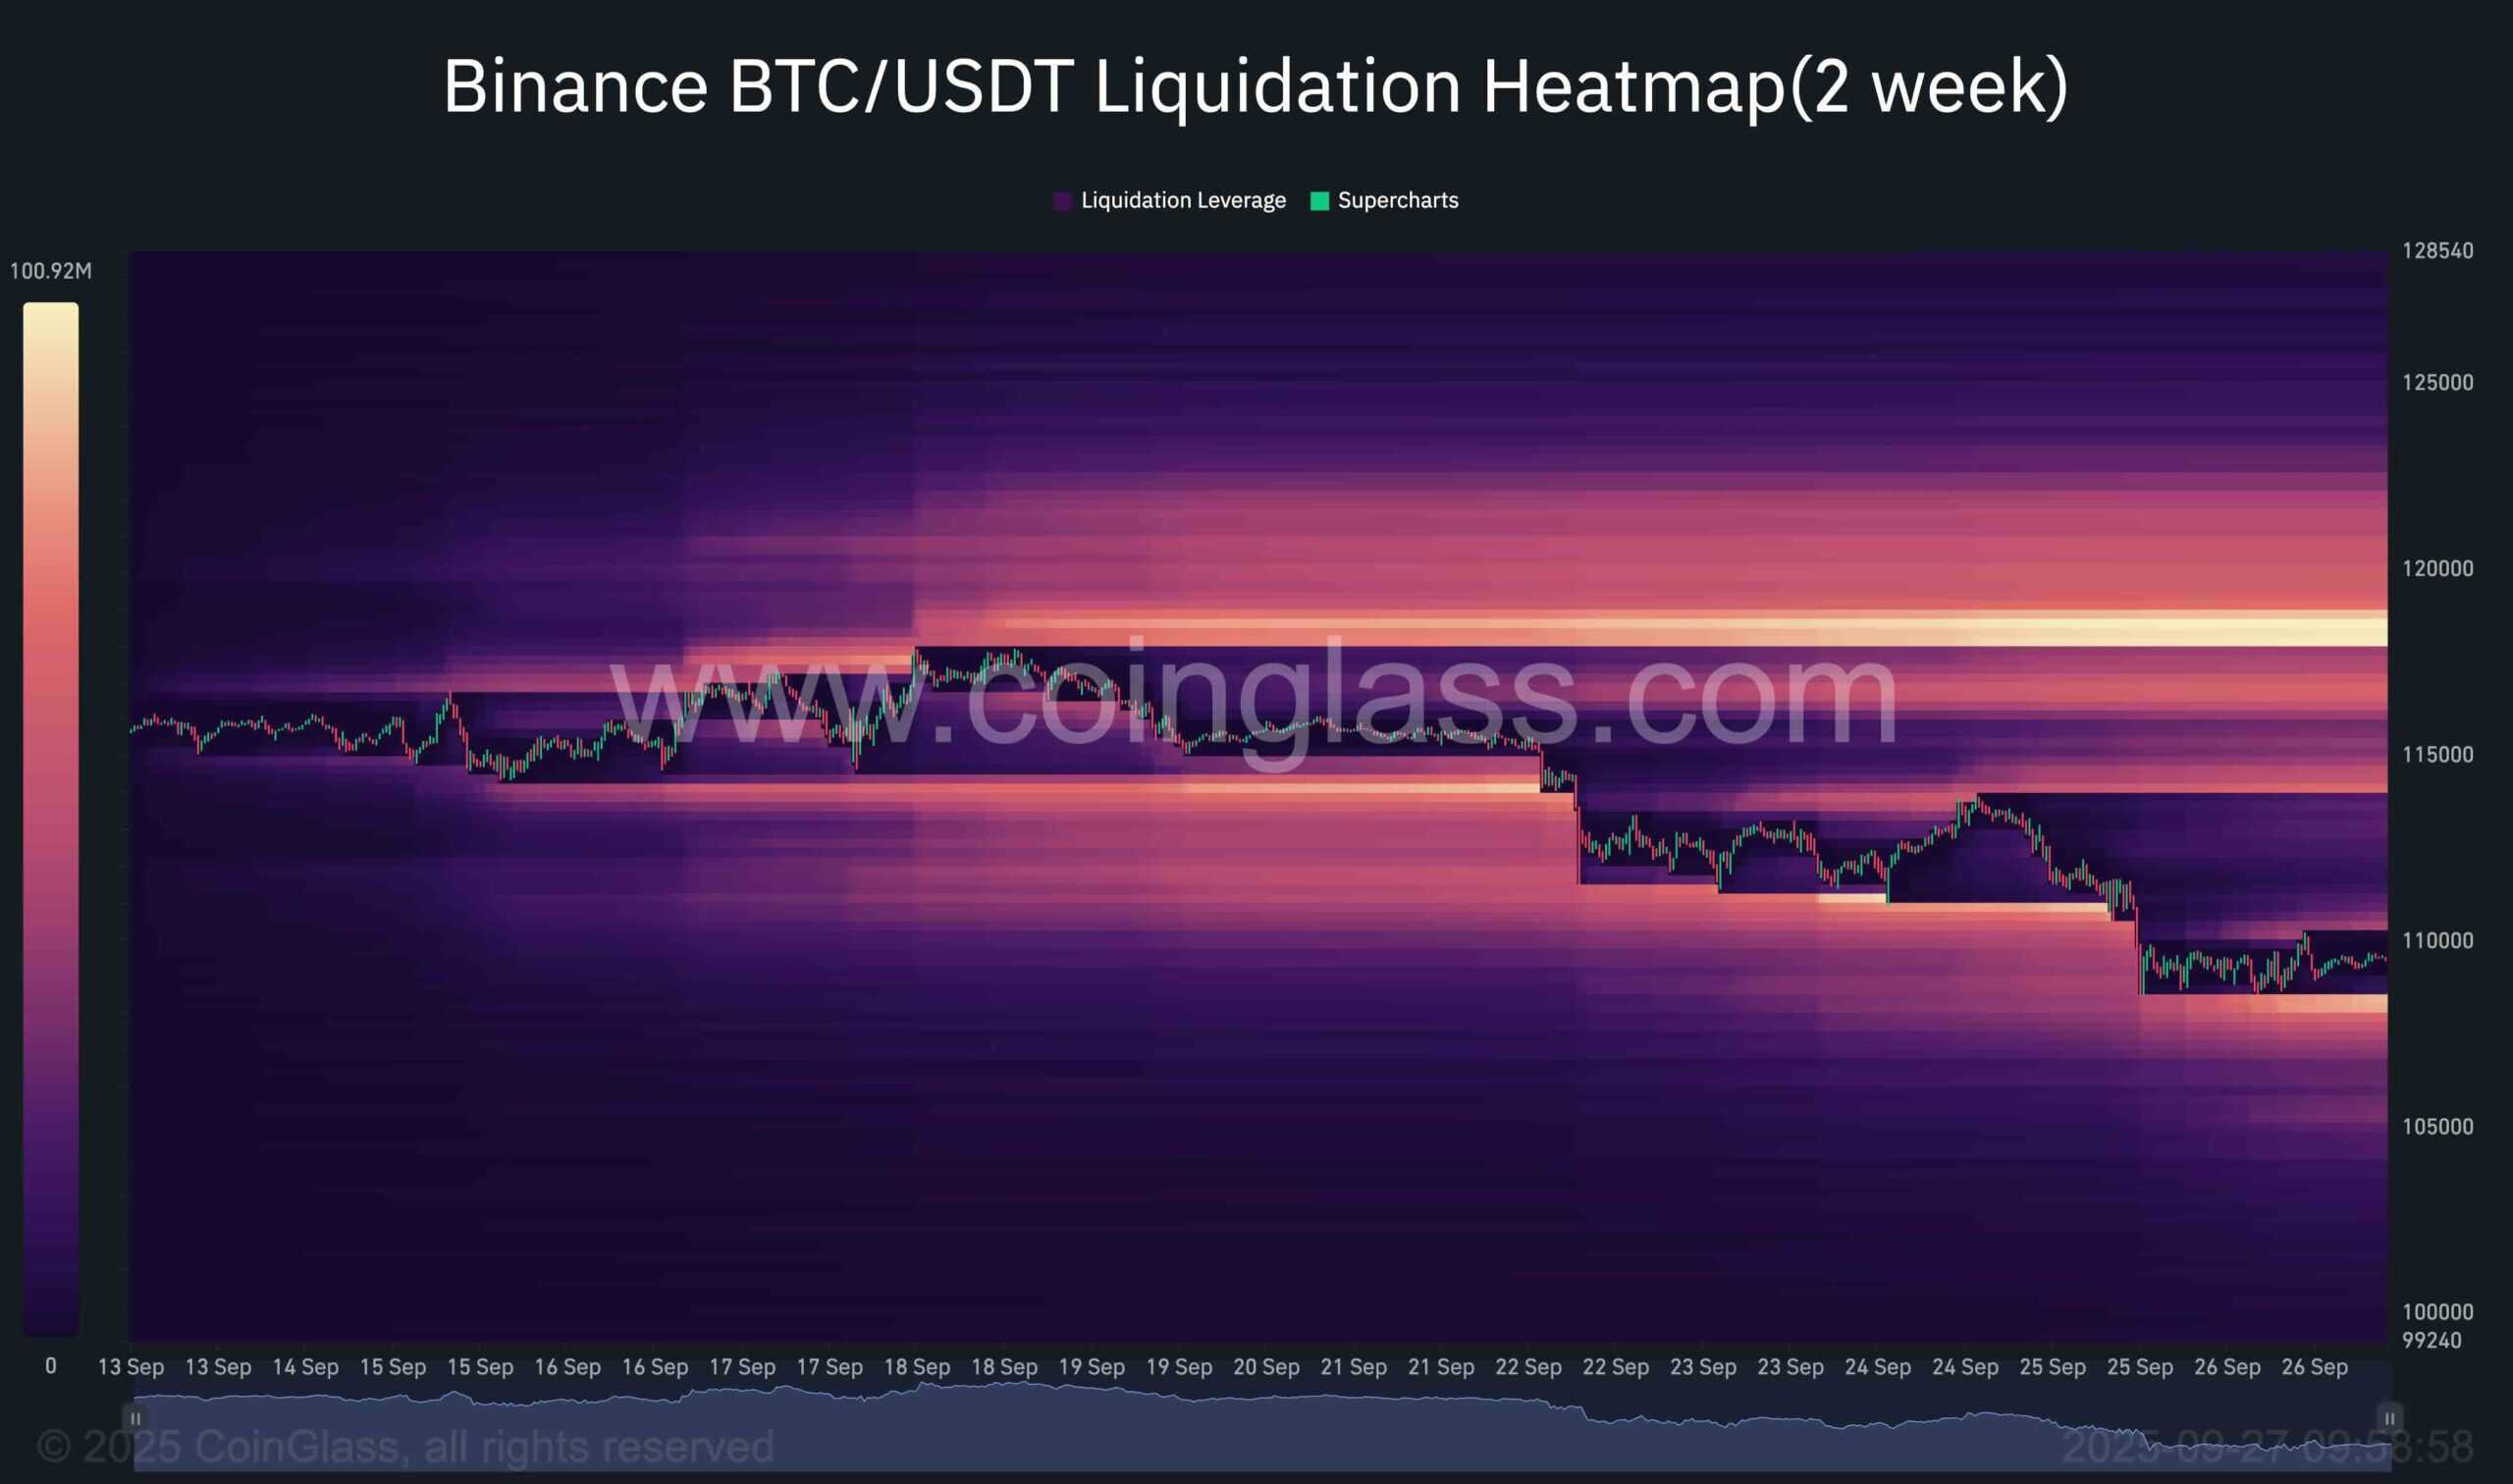
The Binance BTC/USDT liquidation heatmap (2-week view) reveals how recent volatility has been liquidity-driven. A substantial cluster of liquidations has formed above the $117K swing high, where aggressive selling forced longs into liquidation. This band highlights the heavy concentration of stop-losses and overleveraged longs that amplified the rejection.
In contrast, the heatmap shows no major liquidity clusters below the current price, implying that sellers may have already exhausted near-term downside liquidity. With Bitcoin stabilizing around $109K, this absence of downside targets may temporarily limit further declines, unless fresh order FLOW builds below.
For now, the market remains defined by this imbalance: the $117K liquidity band overhead acts as a cap where supply dominates, while the $109K demand base must hold to avoid a deeper slide toward the $100K zone.