Claude AI and ChatGPT Predict Bitcoin’s Epic Surge—’Spring’ Momentum Could Propel BTC to $130K

AI rivals Claude and ChatGPT just placed their bets—and they're all in on Bitcoin. The algorithms see a coiled spring ready to snap, with price targets that'd make even Wall Street's most shameless crypto bros blush.
Spring-loaded tension
Both models detect textbook accumulation patterns suggesting BTC's stuck in a tightening range. When it breaks—and both AIs say when, not if—the resulting surge could rewrite record books.
The $130K gambit
That jaw-dropping target isn't plucked from thin air. The AIs identified three converging technical factors that, historically, precede parabolic moves. Of course, past performance guarantees nothing—except maybe another round of 'I told you so' from crypto Twitter.
Wall Street's watching (and sweating)
Traditional finance still treats crypto like a sideshow, but these AI forecasts are getting harder to ignore. Though let's be real—if BTC actually hits six figures, every hedge fund manager will suddenly 'have been a believer all along.'
Current Market Position and Technical Structure
Bitcoin’s position atrepresents what both models identify as a “compressed spring” setup, trading within an exceptionally tight daily range of just(of current price).
The technical foundation remains overwhelmingly bullish, with price maintaining strength above all major exponential moving averages:EMA at(),EMA at(),EMA at(), andEMA at().
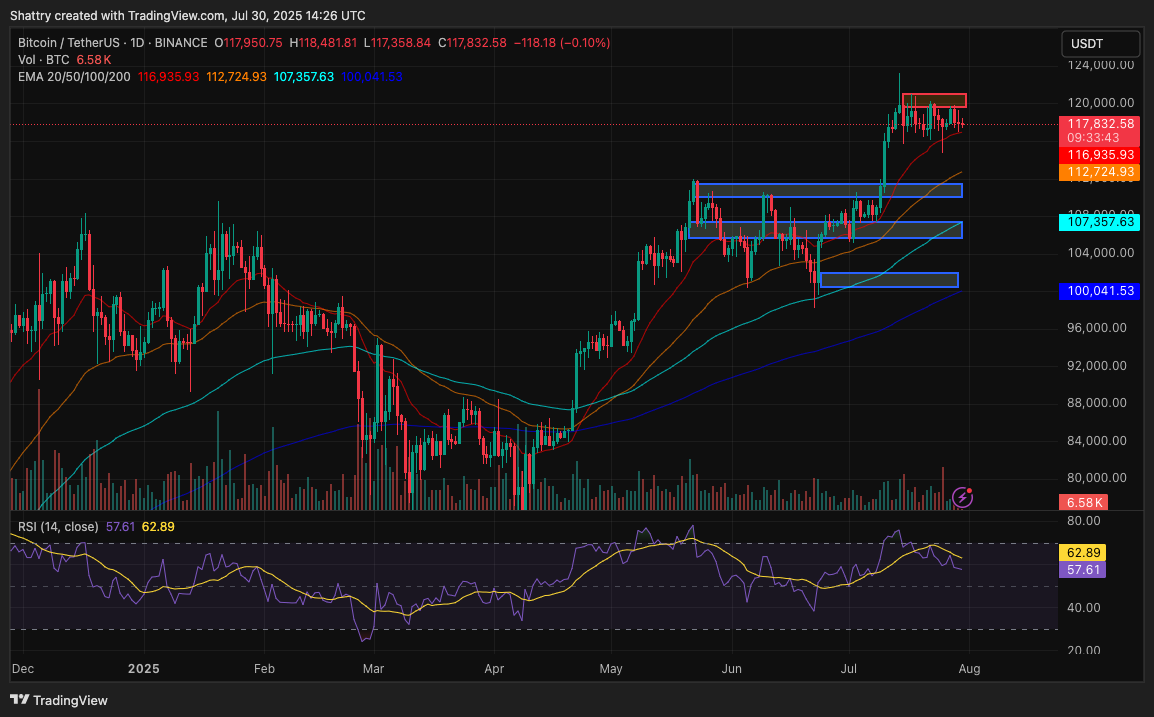
The RSI reading ofsits in neutral territory, which both analyses point out as particularly essential given Bitcoin’s proximity to all-time highs.
Typically, assets trading near historic peaks exhibit overbought RSI readings above, making the balanced momentum reading a bullish divergence sign.
The MACD structure shows mixed signs with the main line atbelow zero, but the positive histogram atsuggests building momentum despite current bearish positioning.

Volume analysis reveals daily trading at justBTC, representing what both models interpret as institutional accumulation rather than distribution.
The extremely high ATR reading ofcontrasts sharply with the current low volatility, creating what technical analysts call a “volatility paradox” that often precedes strong price moves.
Historical Context and 2025 Performance Trajectory
Bitcoin’sjourney provides key context for understanding current positioning. Starting the year atin January, the cryptocurrency experienced a consolidation phase through spring, trading betweenfrom February through May.
June saw a modest close atbefore July’s explosive rally to current levels nearby month-end.
This historical pattern demonstrates Bitcoin’s ability to break from extended consolidation periods with strong momentum, similar to the current setup.
The fact that Bitcoin has maintained its July gains without a major correction suggests underlying strength that both AI models identify as institutional accumulation rather than speculative excess.
Institutional Dynamics and Market Structure
Both analyses emphasize unprecedented institutional adoption as a primary bullish catalyst.
Strategy’s recent acquisition ofBTC worth, bringing total holdings toBTC valued at, represents the scale of corporate treasury adoption accelerating through.
The SEC’s approval of in-kind creation and redemption mechanisms for spot bitcoin ETFs eliminates previous operational friction for institutional participants.
![]() Over 80 million @jpmorgan @Chase customers can now use credit cards to buy crypto on @coinbase, with direct bank links and USDC reward conversions scheduled for 2026. #crypto #banking https://t.co/Cms94p3x7I
Over 80 million @jpmorgan @Chase customers can now use credit cards to buy crypto on @coinbase, with direct bank links and USDC reward conversions scheduled for 2026. #crypto #banking https://t.co/Cms94p3x7I
The JPMorgan-Coinbase partnership allows mainstream banking integration, while companies like Smarter Web Company, which has crossedBTC holdings, and Canaan are adopting Bitcoin as a primary reserve asset, demonstrating the expanding corporate adoption trend.
These developments collectively represent what both models identify as structural changes in Bitcoin’s holder composition, creating more stable price floors and reducing available supply for retail trading.
Current market metrics support this institutional thesis, with market capitalization atand fully diluted valuation at. The circulating supply ofBTC representsof the maximum supply, highlighting growing scarcity as institutional demand accelerates.
Social Sentiment Analysis and Contrarian Signals
Social sentiment data presents a fascinating paradox that both AI models identify as a bullish contrarian sign. Despite Bitcoin trading near all-time highs, retail sentiment has declined to yearly lows, with LunarCrush data showing AltRank downpositions and Galaxy Score decliningpoints.
However, overall sentiment maintainspositivity withengagements andmentions. The key insight both analyses highlight is the divergence between institutional accumulation and retail pessimism.
Not sure about you but i am not worried through #Bitcoin short term upside-downside.
Reason?
Big whales are doing profits booking.
If you look closely $BTC making a pure bullish pennant and liquidations hunting are the part of this game.
Once Bitcoin did its fourth touch near… pic.twitter.com/Bnr2g13lvh
Historical precedent suggests that when smart money accumulates while retail sentiment deteriorates, subsequent moves tend to be particularly explosive as retail FOMO accelerates during breakouts.
The current social dominance ofindicates strong but not extreme retail attention, leaving room for sentiment-driven momentum.
Recent social media analysis reveals approximatelybullish sentiment among active traders, though broader retail metrics suggest caution.
Gold went parabolic after this breakout.
Bitcoin just replicated the pattern.
Double top → Bottom → BOOM.
This is the calm before the crypto storm.
Front-run the $BTC explosion.
You’ve seen this setup before and you know how it ends. pic.twitter.com/GhxZpjtdtr
This mixed sentiment profile creates optimal conditions for institutional positioning without retail competition, a setup both models view as fundamentally bullish.
Regulatory Environment and Policy Catalysts
Both analyses emphasize improving regulatory clarity as a strong bullish catalyst.
The pending WHITE House crypto report, though initially not including strategic Bitcoin reserve details, represents progress toward a comprehensive policy framework.
Today the White House is releasing its comprehensive report on digital assets, providing long-awaited regulatory clarity for innovators in a cutting-edge industry. President TRUMP is delivering on his promise to make the U.S. the crypto capital of the planet. pic.twitter.com/hrp8uQwf76
— David Sacks (@davidsacks47) July 30, 2025The GENIUS Act implementation and broader regulatory developments provide institutional confidence for treasury allocation decisions. Recent headlines confirm accelerating corporate adoption with companies implementing Bitcoin reserve policies and expanding holdings.
This regulatory clarity removes previous institutional barriers, allowing both models to identify the corporate treasury adoption trend as a primarycatalyst.
90-Day Scenario Analysis
Bullish Breakout Scenario (65% Probability)
Both models converge on this scenario as most likely, driven by institutional accumulation acceleration and technical breakout from current consolidation.
The scenario requires decisive movement aboveresistance with volume confirmation, followed by momentum towardresistance cluster within.
Timeline expectations include initial breakout within, consolidation and retest of breakout levels through day, followed by acceleration towardby day.
The more aggressive targets ofdepend on sustained institutional flows and potential positive regulatory developments.
Key success metrics include daily volume expansion aboveBTC, successful hold abovepsychological resistance, and continued institutional accumulation.
The scenario assumes no major macroeconomic disruptions and steady progress on regulatory clarity.
Correction Scenario (25% Probability)
This scenario involves failure to break above the current resistance, leading to testing of major support levels.
Initial decline WOULD target theEMA at, followed by potential testing ofEMA support at. Deeper correction could reach theEMA ator psychologicalsupport.
Trigger events include macroeconomic shocks, unexpected regulatory setbacks, or major institutional selling.
The scenario would unfold over, with initial decline followed by stabilization and potential base-building for future recovery.
Recovery catalysts would include institutional buying at lower levels, positive regulatory developments, or broader risk-asset recovery. Both models view strong institutional selling as unlikely given current accumulation trends.
Extended Consolidation (10% Probability)
This scenario involves continued sideways movement in the current range forbefore directional resolution.
Characteristics include low volume maintenance, ongoing institutional accumulation without retail participation, and delayed catalyst timing.
The consolidation would create optimal accumulation opportunities for institutional participants while allowing technical indicators to reset. Resolution would ultimately favor the bullish scenario given the underlying fundamental strength.
Technical Price Targets and Key Levels
Immediate resistance emerges at today’s high of, with a breakout requiring sustained volume aboveBTC daily.
Key resistance cluster spans, representing previous consolidation highs and psychological levels.
Primary upside targets includeas the first major extension (upside),as a strong resistance cluster (upside), andas aggressive targets (upside). Extended targets reachrepresentingupside potential.
Key support levels include(EMA) as key short-term support,(EMA) as major trend support, and(EMA) as key long-term support.
The(EMA) represents historic trend line support.
Risk Assessment and Management Considerations
Primary risks include macroeconomic volatility from Fed policy changes or geopolitical developments, unexpected regulatory reversals, and technical breakdown below key support levels.
BIG BREAKING![]()
Fed skips rate cut one more time.
Sep-Dec 2024: 3 rate cuts and $BTC went 2x
“Higher For Longer” puts housing markets at risk, slows growth and keep Risk Aseets under pressure. pic.twitter.com/4OyBj1aB2D
The extremely high ATR reading suggests potential fordaily moves during breakout phases, requiring conservative position sizing and wide stop-loss placement.
Risk mitigation strategies include staged profit-taking at,, andlevels, stop-loss positioning below(EMA), and volatility management through options or reduced leverage during high-volatility periods.
Market Structure Evolution and Supply Dynamics
The evolving market structure reflects fundamental shifts in Bitcoin ownership patterns.
Exchange reserves continue declining as institutions MOVE holdings to cold storage, while long-term holders maintain positions despite near-ATH pricing.
Mining operations show reduced selling pressure due to efficient operations and strong price levels.
Demand dynamics show accelerating institutional allocation, consistent ETF positive flows, improving retail access through banking partnerships, and growing sovereign wealth fund interest.
These supply-demand imbalances support both models’ bullish medium-term outlook.
Next Price Trajectory: Synthesis and Conclusion
Synthesizing both AI analyses with current market data reveals a compelling setup for strong upward movement within.
The confluence of technical consolidation near all-time highs, unprecedented institutional accumulation, improving regulatory clarity, and contrarian retail sentiment creates what both models identify as optimal conditions for major price appreciation.
Breakout abovewithin, momentum towardby day, consolidation and retest through day, followed by acceleration towardby day.
- Days 1-14: Breakout above $118,500 with volume confirmation
- Days 15-30: Initial momentum toward $120,000-$122,000 resistance
- Days 31-45: Consolidation and support level testing
- Days 46-75: Resumed uptrend toward $125,000-$130,000
- Days 76-90: Potential extension toward $135,000-$140,000
The current technical setup suggests Bitcoin is positioned for its next major bull leg, with the tight consolidation pattern serving as the launching pad for what could be a historic fourth quarterrally.
The institutional adoption acceleration, regulatory clarity progress, and supply scarcity dynamics support conviction in higher price targets, while the contrarian retail sentiment provides optimal entry conditions before broader market recognition drives prices higher.
