🚨 FARTCOIN Whale Dumps $3.65M – 20% Crash Incoming! Can Bulls Defend $2?

FARTCOIN just got rocked by a mega-whale exit—$3.65M worth of sell pressure triggered a brutal 20% nosedive. Traders are now scrambling to assess whether the meme coin's $2 support level can hold or if this is the start of a deeper capitulation.
Whale Watch Turns Bloody
The blockchain doesn't lie: a single wallet unloaded a FARTCOIN position worth seven figures, instantly vaporizing liquidity. The move echoes last month's 'sell-the-news' dump after the token's viral TikTok pump—proving once again that crypto influencers have the attention span of a goldfish.
Technical Breakdown
With RSI now oversold and the 4-hour chart printing lower highs, bears are eyeing a retest of the $2 psychological level. If that fails? 'Number go down' technology could send FARTCOIN back to pre-hype levels—where it belongs, frankly.
Just another day in the meme coin casino—where the house always wins, and retail bags the losses.
FARTCOIN Loses Top Memecoin Status, But Bulls See Buying Opportunity for a $2 rebound
The price crash has cost FARTCOIN its position as Solana’s leading memecoin, with BONK reclaiming the top spot. FARTCOIN now ranks fourth in the Solana memecoin hierarchy, trailing behind PENGU and TRUMP.
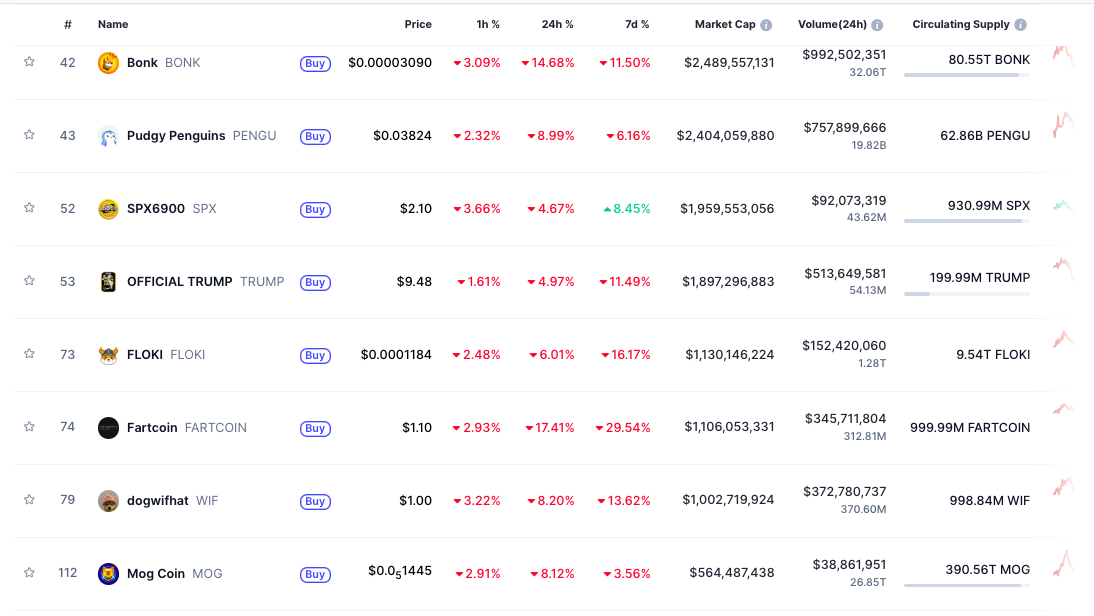
The Solana-based token is trading at $1.09 and has shed over 29% of its value in the past week, facing the risk of breaking below the key $1.00 support threshold.
The sharp decline has resulted in $12.4 million of liquidations from FARTCOIN long positions over the past 24 hours, marking the second-highest liquidation volume among memecoins during this period.

However, market sentiment data from Coinvo indicates the current sell-off could present an attractive entry point for investors who missed the token’s 400% surge from April lows. FARTCOIN maintains a robust 77% buyer ratio despite prevailing bearish conditions.
Memecoin trader “Bmerke” noted historical parallels, noting that “during the last two FOMC meetings (May 6 and June 18), FARTCOIN traded at these exact levels we’re seeing today. Both instances were followed by new all-time highs shortly after.”
Interesting:
The last 2 FOMC Meetings (May 6/June 18) Fartcoin was at these exact same levels we are today. Each proceeded to make a new high shortly after.
Everyone who derisks today will buy back in by the weekend. Just how it works. pic.twitter.com/5EChpaLEG2
He further predicted that “everyone who panic-sold their holdings today will be forced to buy back at higher prices by the weekend.”
Smart Money Still Bullish on FARTCOIN to $2
Supporting the bullish thesis, Nansen’s AI wallet tracker shows FARTCOIN remains the most favored memecoin among sophisticated investors, with 24 smart money wallets holding $19.03 million worth of tokens.
This exceeds holdings in popular alternatives like Pepe ($5.75 million) and BONK ($2.27 million).
Crypto analyst Jireon0X identified FARTCOIN as “coiling tightly within an ascending triangle formation, maintaining trendline support following a healthy pullback.”
According to his analysis, “the $1.1 support level must hold to enable a rebound toward $1.50, while a decisive breakout above $1.62 could propel FARTCOIN toward the coveted $2 target.”
$FART is hugging trendline support after a healthy pullback.
A clean breakout above $1.62 and $FART might just fly past $2![]()
Load up or get left behind![]()
![]() pic.twitter.com/JrdVKIUNnQ
pic.twitter.com/JrdVKIUNnQ
FARTCOIN Technical Analysis: Oversold Conditions Indicate Potential Bounce
The 4-hour FARTCOIN/USDT chart displays a strong breach of the previously established ascending channel pattern.
Price action had been progressing upward within parallel blue and red trendlines, maintaining a bullish trajectory from late June through mid-July.
This technical structure experienced a decisive downside break, indicating deteriorating upward momentum and indicating a potential trend reversal.
With price action now below the ascending channel and approaching the previous consolidation zone between $0.87–$1.00, downward pressure continues to intensify.
The Relative Strength Index registers 27.14, firmly positioned in oversold territory.
While bearish momentum persists, this extreme reading suggests a temporary bounce or corrective rally may be approaching due to potential selling exhaustion.
Based on the current chart structure and RSI conditions, price is likely to test the $1.00–$1.10 zone as a short-term foundation before attempting any recovery.
Should a bounce materialize, traders should monitor the $1.40 area as the next key resistance level, with a possible challenge of the $1.543 barrier if bullish momentum resurfaces.
However, failure to maintain support above $1.00 could trigger deeper losses toward the $0.87 support zone identified on the chart, potentially invalidating the near-term recovery scenario.
