ONDO Soars 60% in 30 Days – Will 21Shares’ ETF Push Propel It to $2?

Crypto's latest moon mission: ONDO defies gravity with a 60% monthly rally. Now, Wall Street's knocking.
ETF catalyst incoming?
21Shares just filed paperwork that could legitimize this rocket fuel. Traders whisper $2 targets—while Bitcoin maxis scoff at 'another altcoin distraction.'
Behind the numbers:
- 60% gain since June 23
- ETF filing drops July 23
- $2 = next psychological barrier
Remember kids: In crypto, every 'institutional endorsement' starts with a speculative frenzy. (Thanks for the volatility, suits.)
Institutional Foundation and ETF Filing Can Lead ONDO to $2
Ondo Finance operates as a layer-1 proof-of-stake blockchain specifically designed for institutional finance and the tokenization of real-world assets (RWAs).
The platform has established a strong foundation in the institutional space through strategic collaborations.
In February, the project partnered with major institutional finance players, including Franklin Templeton, WisdomTree, Google Cloud, McKinsey, BlackRock, PayPal, and Morgan Stanley, to launch the Ondo Finance Chain, a dedicated layer-1 protocol focused on real-world asset tokenization.
![]() @jpmorgan’s Kinexys just executed a tokenized U.S. Treasuries trade on @OndoFinance Chain and settled cross-chain using @chainlink’s secure infra.#jpmorgan #ondo https://t.co/syovKOC8fI
@jpmorgan’s Kinexys just executed a tokenized U.S. Treasuries trade on @OndoFinance Chain and settled cross-chain using @chainlink’s secure infra.#jpmorgan #ondo https://t.co/syovKOC8fI
Last week marked another milestone when BNB Chain, Binance’s blockchain network, announced a partnership with Ondo Finance to integrate tokenized real-world assets into its ecosystem.
This collaboration seeks to bridge Wall Street with BNB Chain, bringing over 100 U.S. stocks, exchange-traded funds (ETFs), and investment funds to Ondo Finance while maintaining traditional finance liquidity.
Several months earlier, Ondo Finance secured another major partnership by joining Mastercard’s Multi-Token Network as a provider of tokenized real-world assets, further solidifying its position in the institutional landscape.
Can ONDO Hit $2?—Analysts Eye $27 Trillion Treasury Market
Cryptocurrency traders are viewing the recent price correction as a buying opportunity, believing ONDO has the potential for upside movement similar to XRP, which has also gained favor among traditional finance institutions.
Chart analyst ‘Crypto Targets’ has identified that ONDO is currently in a double accumulation phase, with bullish RSI divergence and breakout structure alignment.
Double accumulation phase![]()
RSI divergence bullish![]()
Breakout structure weekly![]() $ONDO just flipped the macro neckline
$ONDO just flipped the macro neckline
What comes next ? Expansion![]() Target: $4 pic.twitter.com/zcgrrE0Vb6
Target: $4 pic.twitter.com/zcgrrE0Vb6
The analysis suggests that ONDO has successfully flipped the macro neckline, potentially setting the stage for expansion beyond $2.
Financial educator Kren has provided an even more bullish long-term perspective, noting that the U.S. Treasury market is valued at approximately $27 trillion. If ONDO were to capture just 0.1% of this market, the token could theoretically trade at $6.75 per unit.
Technical Analysis: ONDO Charts Indicate $1.61 Breakout After 9% Correction
The daily ONDO/USDT chart reveals a clear bullish trend that recently encountered strong resistance at the $1.1732 level, representing the July highs.
Following a substantial rally from the July opening NEAR $0.7697, the price successfully broke through key moving averages (EMAs 20, 50, 100, and 200), indicating positive momentum.
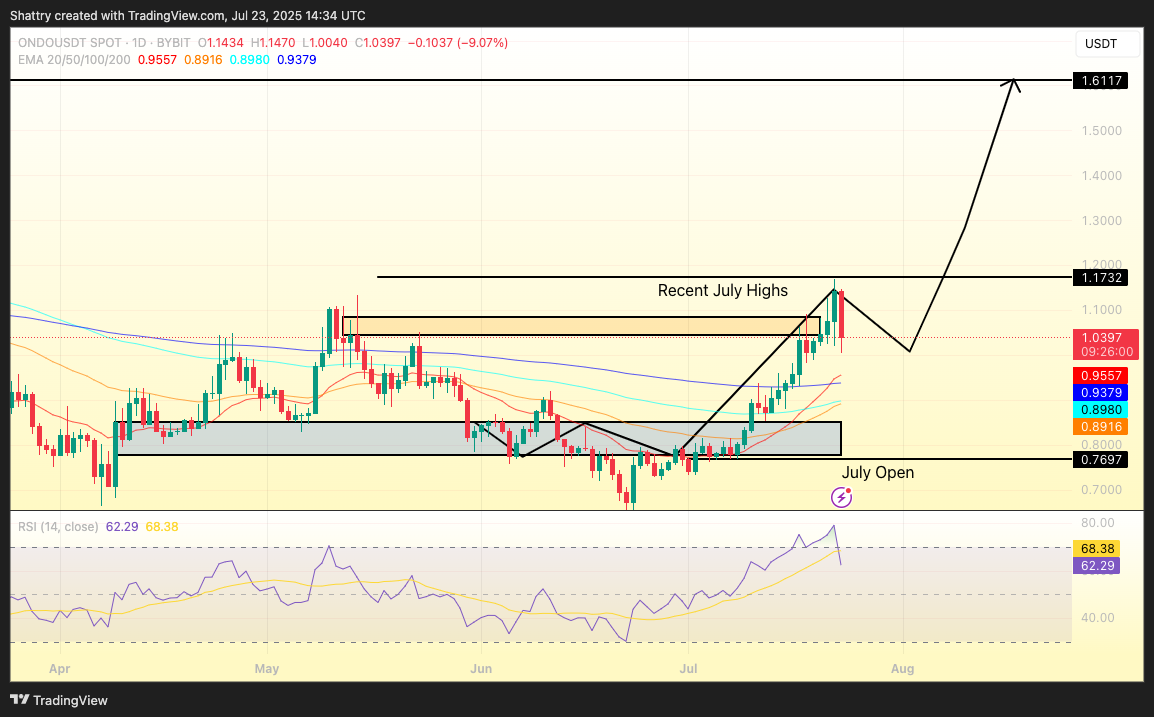
Today’s trading session, however, shows a sharp 9% pullback, with the token closing at $1.0397, indicating temporary exhaustion in buying pressure.
Despite this correction, the overall trend structure remains intact. The Relative Strength Index (RSI) currently sits at 62.29, positioned just below the overbought threshold, suggesting room for a potential rebound without overheating concerns.
If the current correction maintains support above the moving average cluster, particularly the EMA 20 at $0.9557 and EMA 50 at $0.9379, the technical setup favors the formation of a higher low.
The projected trajectory indicates a possible short-term consolidation below the July highs, followed by a bullish continuation toward the next major resistance level at $1.6117.
Should the price fail to maintain support above the EMAs, it could retreat into the consolidation range between $0.80 and $0.90.
However, the current market structure supports a bullish continuation following this temporary pullback.
