Bitcoin Dips Below $95K – Yet ETF Demand Hits Statistical Extremes: Are Whales Accumulating Again?

Bitcoin just sliced through the $95,000 support level, but don't let the price action fool you. Beneath the surface, a tidal wave of institutional capital is flooding in.
The ETF Anomaly
Spot Bitcoin ETF inflows just hit a statistical extreme not seen in months. Daily volumes are screaming off the charts, creating a glaring divergence from the spot price. It's the classic 'smart money vs. scared money' playbook playing out in real-time.
Whale Watching Season
When ETFs suck up coins at a record pace during a dip, it's not retail panic buying. That's accumulation. Large, block-sized orders are hitting the tape, suggesting deep-pocketed players are using the pullback as a loading zone. They're not trading the headline; they're trading the flow.
The Cynical Take
It's almost poetic: Wall Street's shiny new ETF wrapper, the very symbol of mainstream acceptance, becomes the vehicle for the next coordinated whale pump. The suits finally get it, and their first move is to execute the oldest play in the crypto book. Some things never change.
So, is this a bear trap or a bull flag? The price chart shows fear. The capital flow shows conviction. One of them is about to be very wrong.
 Source: Glassnode
ETF Demand Reaches Statistical Extremes
U.S. spot bitcoin ETF flows executed a sharp reversal last week, swinging from $1.3 billion in outflows to $1.7 billion in inflows and pushing activity well beyond statistical norms.
The extreme reading indicates renewed institutional accumulation, with weekly ETF trading volume surging from $16.8 billion to $21.8 billion and both metrics sitting above their historical ranges.

BlackRock’s IBIT dominated the inflow surge, capturing $1.035 billion during the January 12–16 trading week and accounting for nearly three-quarters of total Bitcoin ETF demand.
CryptoQuant CEO Ki Young Ju confirmed the institutional accumulation trend, stating, “Institutional demand for Bitcoin remains strong.“
Institutional demand for Bitcoin remains strong.
US custody wallets typically hold 100-1,000 BTC each. Excluding exchanges and miners, this gives a rough read on institutional demand. ETF holdings included.
577K BTC ($53B) added over the past year, and still flowing in. pic.twitter.com/kG1c8dTvlq
He noted that U.S. custody wallets (typically holding 100 to 1,000 BTC each) added 577,000 BTC worth $53 billion over the past year, with flows continuing into January despite price consolidation.
The ETF MVRV ratio edged up to 1.71, sitting just above its upper statistical band and indicating ETF holders remain comfortably in profit.
Glassnode analysts flagged this elevated profitability as introducing a mild near-term profit-taking risk, though overall sentiment remains constructive as institutions continue to build positions.
Mixed Derivatives Positioning Amid Cooling Leverage
Futures markets sent mixed signals as open interest ROSE from $31.0 billion to $31.5 billion, reflecting what Glassnode analysts term as “” rebuilding of speculative engagement.
Funding rates collapsed by 60.6%, from $1.5 million to $0.6 million daily, indicating sharply reduced long-side urgency and a more balanced positioning after recent exuberance.
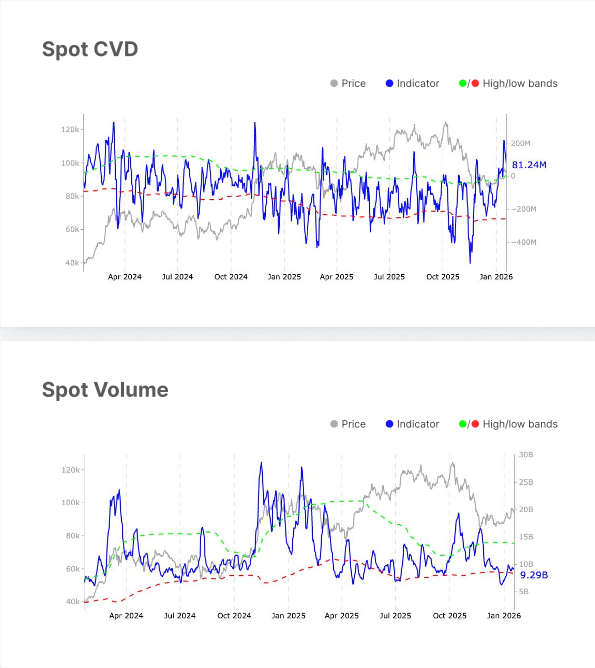
Perpetual cumulative volume delta improved from -$437.7 million to -$6.2 million, breaking above its upper statistical band.
Options markets continued to price elevated uncertainty, with open interest rising from $29.96 billion to $32.89 billion while the volatility spread widened from 42.8% to 44.6%, near the upper end of its historical range.
On-Chain Activity Stabilizes With Cautious Improvement
Fundamental blockchain metrics showed tentative recovery across multiple indicators.
Active addresses increased 3.8% to 656,294, remaining below the lower statistical band but suggesting improving network engagement without speculative excess.
Entity-adjusted transfer volume rose 3.9% to $8.6 billion, maintaining balanced on-chain activity.
Bitcoin fee volume climbed 13.2% to $241,100, rising above the lower statistical band.
The short-term-to-long-term holder supply ratio also increased from 16.7% to 17.0%, moving above its upper statistical band amid growing trading activity alongside potentially higher volatility.
Realized cap change also improved from -0.3% to -0.1%, indicating stabilizing capital flows and easing sell-side pressure.
The percent of supply in profit rose from 70.6% to 75.1%, while net unrealized profit/loss improved from -8.1% to -3.8%, with both metrics indicating reduced market stress and recovering investor sentiment.
Ethereum ETFs particularly demonstrated strength in December, with Fidelity’s FETH attracting $59.25 million and Grayscale’s ethereum Mini Trust adding $39.21 million, ranking among the top 10 U.S. ETPs by net inflows.
January flows accelerated further, with spot Ethereum ETFs capturing $479 million during the Jan. 12–16 week, led by BlackRock’s ETHA at $219 million.
