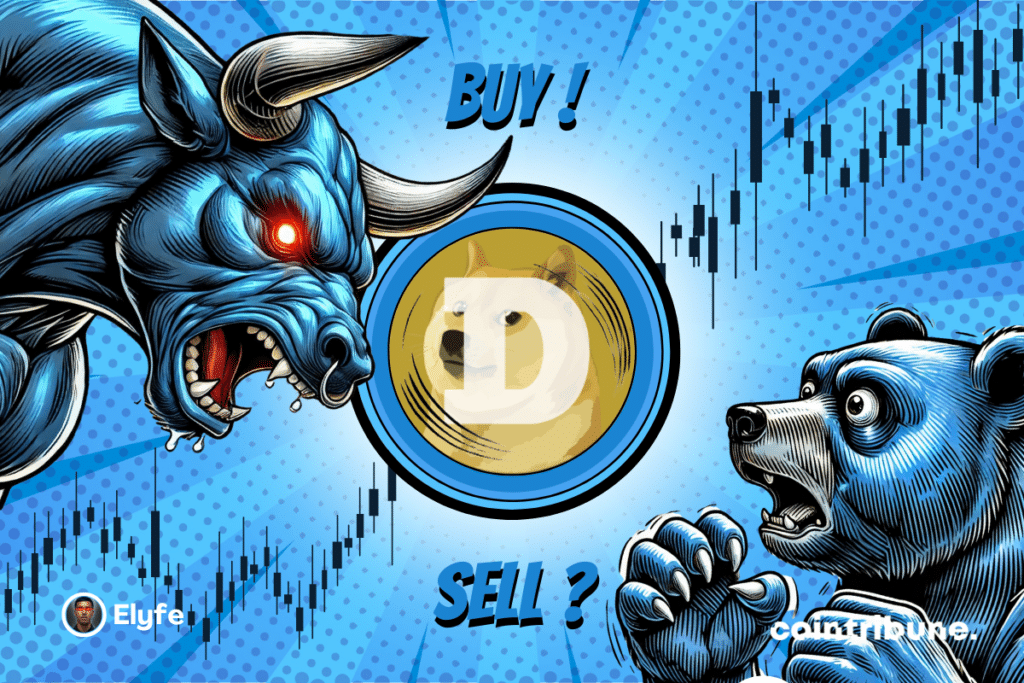
Dogecoin Teeters on the Edge—Is This the Breakout Week?

Memecoins are having a moment—again. And Dogecoin, the OG of joke tokens, is flashing signals that could make even Wall Street’s most jaded traders glance up from their spreadsheets.
Here’s what the charts say as of May 22, 2025:
The Bull Case: DOGE has coiled into a tightening wedge pattern—classic breakout fuel. Volume’s creeping up while whales accumulate, and the 50-day MA just crossed above the 200-day. Even the stodgy ’fundamentals’ crowd is whispering about exchange netflows turning positive.
The Bear Trap: But let’s not pop champagne yet. Resistance at $0.35 has rejected three tests this month. RSI’s flirting with overbought territory, and let’s be real—this is Dogecoin we’re talking about. The ’fundamentals’ involve a Shiba Inu and Elon Musk’s tweet drafts.
Bottom Line: Either DOGE smashes through $0.40 this week and rides the gamma squeeze to lunacy, or it becomes another ’wen lambo’ gravestone in crypto’s meme-coin cemetery. Place your bets—just maybe hedge with something that has, you know, actual utility. (We kid... sort of.)
In Brief
- Price & trend: DOGE is trading around $0.24 in consolidation, with an upward trend and momentum recovering.
- Key levels: Resistances at $0.26+, supports around $0.16. Breaking out of this zone could trigger a strong move.
- Derivatives: Increase in open interest, declining CVD with rising price (selling absorption), slightly positive funding.
- Forecasts: Bullish bias above $0.21, target at $0.43. Risk of pullback to $0.13 if bearish breakout. The macro context remains decisive.
Technical Analysis of Dogecoin (DOGE)
| Spot Price | ≈ $0.24 | The price is currently in a consolidation phase. |
| Recent Weekly Changes | ≈ +0.56% | A technical pause is underway after a significant upward move, suggesting a market breathing phase. |
| Weekly Spot Volumes | ≈ 6.57 B (+32%) | Activity is intensifying strongly, signaling a more marked market engagement. |
| Long-Term Trend | Bullish | The structure is evolving consistently while maintaining a clear upward direction. |
| Medium-Term Trend | Bullish | The upward movement continues at a steady pace, supported by a confirmed recovery. |
| Short-Term Trend | Bullish | Price action maintains strong bullish momentum, driven by persistent buying pressure. |
| Momentum | Recovery | After a phase of weakening, momentum is gradually picking up again. |
The Doge price trades around $0.24, a key level where the market frequently reacts. After a strong rise, the weekly change stabilizes at +0.56%, suggesting a technical pause. Weekly spot volumes reach 6.57B, up 32%, reflecting a significant renewed interest. The trend remains bullish across all timeframes: the long-term progresses steadily, the medium-term shows clear acceleration, and the short-term maintains a sustained pace. Momentum, after weakening, is gradually recovering, confirming an ongoing rebound.
Technical Levels of Dogecoin (DOGE)
| Resistances | $0.26 / $0.29 / $0.31 / $0.43 | Potential distribution zones; surpassing them would open the way for an upward extension. |
| Supports | $0.21 / $0.16 / $0.15 / $0.13 | Historical demand zones; breaching them would expose to risk of further decline. |
| Monthly Pivot Point | $0.16 | Reference level for the month’s trend. |
| High Value Area | $0.39 | High volume area; upper bound of market equilibrium, beyond which imbalance may emerge. |
| Low Value Area | $0.17 | High volume area; lower bound of market equilibrium, beyond which imbalance may emerge. |
Dogecoin trades between several key technical levels. Resistances located at $0.26, $0.29, $0.31, and $0.43 represent potential distribution zones, whose breakout could trigger a bullish continuation. Conversely, supports at $0.21, $0.16, $0.15, and $0.13 correspond to historical demand zones; their breach WOULD expose the market to extended downside risk. The monthly pivot at $0.16 serves as a reference level to evaluate the underlying trend. Finally, the high value area at $0.39 and the low value area at $0.17 delimit a market balance whose exit could signal a return of volatility.

The current technical analysis was conducted in collaboration with Elyfe, and 0xhugzer, investors and educators in the cryptocurrency market.
Derivatives Analysis (DOGE/USDT)
| Open Interest | Rising | Increase in open positions, a sign of growing market interest. |
| CVD | Selling absorption | CVD declines, but price remains stable, indicating buying resistance against selling pressure. |
| Liquidation | Low, on long side | Overall low liquidations, but more on the buyer side, consistent with slight selling pressure. |
| Funding Rate | Slightly positive | Minor bullish bias, moderate premium for long positions. |
Market data show an increase in open interest, reflecting renewed participant engagement. The declining CVD, coupled with rising prices, suggests effective absorption of selling pressure by passive buyers. Liquidations remain low, with a slightly marked bias towards long positions, consistent with moderate but present selling pressure. Finally, a slightly positive funding rate reflects a minor advantage given to long positions, indicating a measured bullish sentiment.

| Indicator | Status | Comment |
| Seller Liquidation Zone | ≈ $0.248 – $0.251 / $0.254 / $0.264 – $0.267 | Order concentration zone; reaching these levels could trigger increased volatility. |
| Buyer Liquidation Zone | ≈ $0.201 – $0.199 / $0.19 / $0.18 – $0.173 / $0.164 – $0.154 | Order concentration zone; reaching these levels could trigger increased volatility. |
The Doge price hovers around $0.24, a key level frequently reacted to by the market. After a strong rise, the weekly change limits at +0.56%, reflecting a consolidation phase. Weekly spot volumes reach 6.57B, increasing 32%, signaling growing participation. The trend remains bullish across all timeframes: long-term is stable and oriented; medium-term shows acceleration; short-term buying pressure remains strong. Momentum is recovering with a gradual restart after a weakening phase. Several liquidation zones are identified: on the seller side between $0.248 and $0.267, and on the buyer side between $0.201 and $0.154; reaching these levels could lead to a sudden surge in volatility.

Forecasts for Dogecoin (DOGE) Price
Bullish scenario:
- Conditions: Stay above $0.21.
- Targets: $0.26 / $0.29 / $0.43 and beyond.
- Potential: Approximately +79% from the current level.
Bearish scenario:
- Conditions: Break below $0.21 support.
- Targets: $0.16 / $0.15 / $0.13.
- Potential: Decline up to -46% from the current level.
Comment:
The bias remains bullish, but US macroeconomic indicators and news related to the global geopolitical context will be decisive to confirm this scenario.
DOGEUSD chart by TradingViewConclusion
Dogecoin is in a consolidation phase after a strong rise. The trend remains bullish across all horizons, with increasing activity and renewed market momentum. Key levels frame the price, and a breakout could lead to strong volatility. Sentiment remains positive, but caution is warranted given the overall economic context. In this environment, it will be essential to closely monitor price reactions at strategic levels to confirm or adjust current forecasts.
Finally, remember that these analyses are based solely on technical criteria, and cryptocurrency prices can change quickly based on other more fundamental factors.
Interested in this study? Find our latest solana analysis.
Maximize your Cointribune experience with our "Read to Earn" program! For every article you read, earn points and access exclusive rewards. Sign up now and start earning benefits.
