Bitcoin Shatters Records: New All-Time High Reached But Warning Signs Flash - Technical Analysis October 10, 2025

Bitcoin rockets past previous milestones, setting fresh historical peaks that have traders both celebrating and sweating.
The Psychology of Peaks
When digital gold hits unprecedented levels, euphoria meets extreme caution. Every previous cycle taught harsh lessons about parabolic moves.
Technical Red Flags
RSI readings scream overbought across multiple timeframes. Volume divergence appears as price climbs while trading activity cools—classic distribution pattern emerging.
Support Levels to Watch
Key Fibonacci retracements loom below current prices. Break these and the correction could get ugly faster than a leveraged long position during a flash crash.
Institutional Dilemma
Wall Street's late arrival means they're buying at the top—again. Because nothing says sophisticated investing like chasing 200% gains after they've already happened.
The throne remains Bitcoin's for now, but coronation ceremonies in crypto often end with someone losing their crown—and their shirt.
 Read us on Google News
In Brief
- Technical analysis: Bullish structure across all timeframes, supported by a rebound on support and a bullish breakout to a new ATH.
- Technical levels: Strong supports around $108,150 – $105,000, key resistance at $126,293.
- Market sentiment: Dominant confidence, supported by ongoing but slowing institutional inflows.
- Derived analyses: Open interest rising, positive funding, liquidations mainly on the short side.
- Forecasts: Bullish bias above $119,345, but risk of correction towards $117,500 if broken.
BTC/USD Technical Analysis
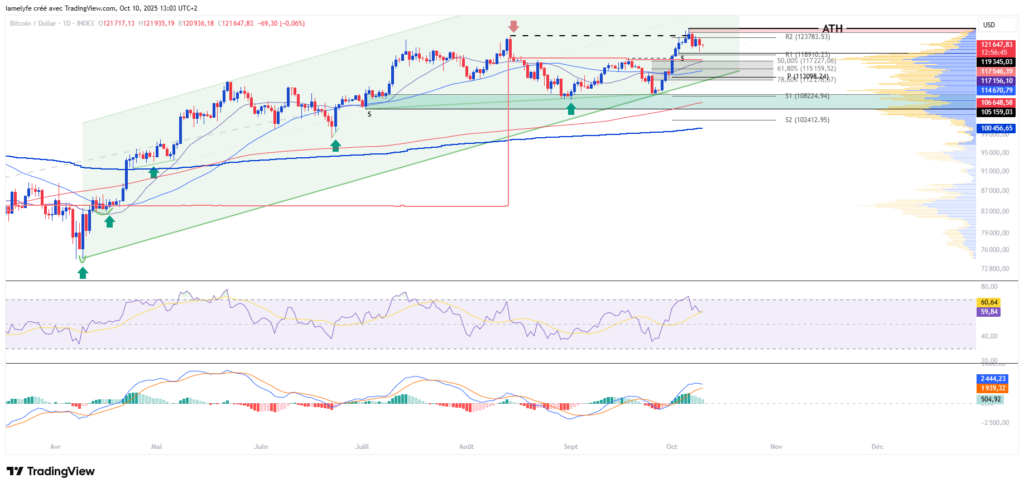
Bitcoin is trading at $121,200, after a week marked by strong upward volatility (+10%). The rebound observed on the support zone ($108,000) led to a resistance breakout towards a new all-time high. Weekly spot volumes reach $35 billion (+36.6%), reflecting renewed investor interest.
In terms of trends, the 200 SMA confirms long-term bullish strength, while the 50 and 20 SMAs validate a positive orientation in the medium and short term. Momentum shows a revival of dynamics, although oscillators indicate slight exhaustion after the recent acceleration.
The current technical analysis was conducted in collaboration with Elyfe, investor and educational creator in the cryptocurrency market.
Bitcoin (BTC) Technical Levels
The market is organizing around several key thresholds. The major resistance is now at $126,293, corresponding to the new ATH. This level represents a critical threshold, likely to act as a distribution zone if buying pressure fades.
Supports between $108,150 and $105,000 FORM strategic defense zones, where accumulation could start in case of a pullback.
The monthly pivot at $113,098 lies below the current price, reinforcing the ongoing background bullish structure.
Finally, the volume profile highlights a high-value zone at $122,700 and a low-value zone at $117,400, limits of a market equilibrium whose break could amplify volatility.
Market Sentiment
The overall sentiment is now dominated by greed, reflecting growing confidence among players. Flows to BTC spot ETFs remain positive but show a slowdown: most of the inflows have already supported the recent rise. This situation suggests that, although institutional confidence remains, the potential for bullish surprise could diminish in the short term.
Derivatives Analysis (BTC/USDT)
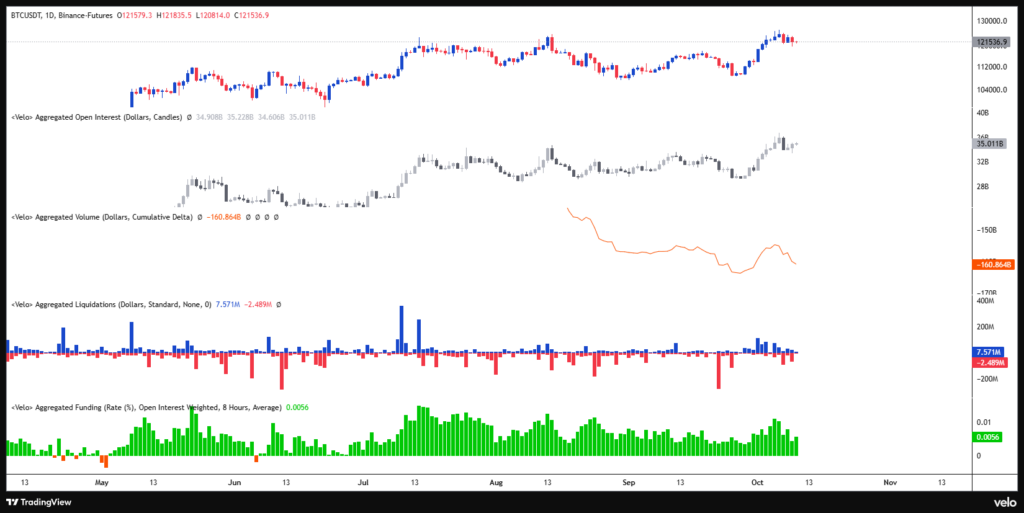
The derivatives markets confirm the dominant bullish bias. Open interest is rising significantly, indicating a speculative repositioning upwards. The CVD (Cumulative Volume Delta) remains balanced, reflecting shared activity between buyers and sellers. The funding rate stays positive and persistent, showing a clear bullish bias without signaling excessive overheating. Recent liquidations mainly affected short positions, a direct consequence of the breakout movement towards the ATH.
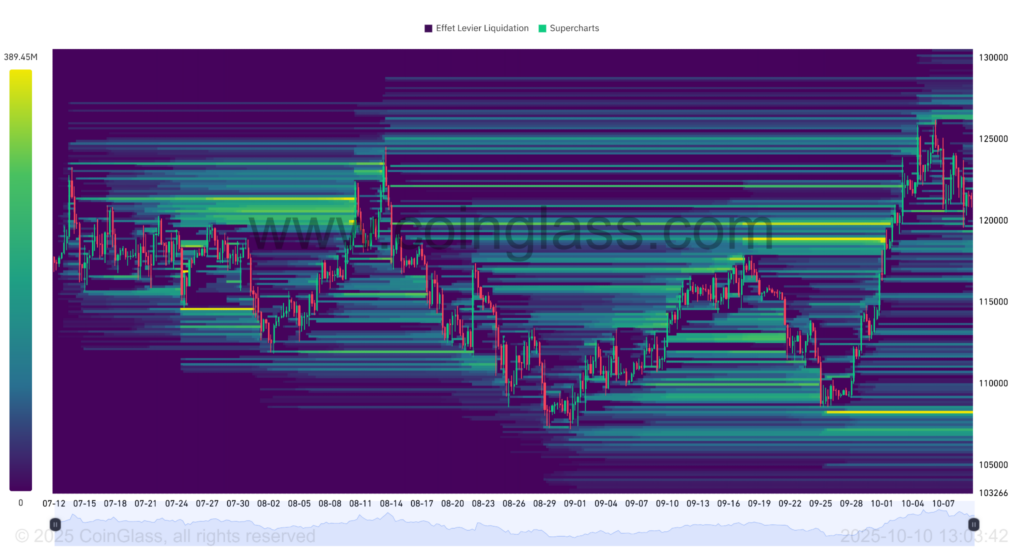
The selling liquidation zone, between $126,350 and $127,600, appears as a critical threshold: crossing it could strengthen the bullish momentum through a squeeze effect but could also serve as a distribution zone if momentum fades.
Conversely, the buying liquidation zone, located between $108,200 and $106,500, remains vulnerable to a breakout. Such a break could trigger a bearish acceleration, while representing a potential interest point for strategic accumulation.
Bitcoin (BTC) Price Forecasts
Bullish Scenario:
- Conditions: Price holding above $119,345.
- Targets: $124,255 / $126,300 (ATH) and possible extensions.
- Potential: About +4% from the current level.
Bearish Scenario:
- Conditions: Break of support at $119,345.
- Targets: $117,500 / $113,000 / $108,200.
- Potential: About -11% from the current level.
Conclusion
Bitcoin maintains a solidly bullish technical structure, driven by breakthroughs of its major resistances and a resurgence in volume activity. Derivatives confirm this direction, although sentiment overheating and slowing institutional flows call for caution. In this context, it will be essential to closely monitor price reactions at strategic levels to confirm or adjust current forecasts. Finally, let us remind that these analyses are based solely on technical criteria, and cryptocurrency prices can evolve rapidly depending on other more fundamental factors.
Did this study interest you? Find our latest ethereum analysis.
Maximize your Cointribune experience with our "Read to Earn" program! For every article you read, earn points and access exclusive rewards. Sign up now and start earning benefits.
