SUI Eyes $5 as Bullish Pattern Sparks Optimism—But Can It Dodge Crypto Gravity?

SUI’s chart flashes a rare bullish signal, teasing a potential breakout toward $5. Traders are loading up on hopium—but will macro headwinds clip its wings?
Key drivers: The token has carved out a stubborn support zone after its last correction. Now, volume spikes suggest accumulation by whales eyeing a retest of its ATH.
Reality check: Every ’sure thing’ pattern since 2022 has faced a brutal smackdown from Fed policy. This time, SUI’s fate hinges on whether crypto can finally bypass traditional finance’s chokehold.
SUI Showing Strong Strength
This bullish momentum coincides with 21Shares’ last week announcement of entering a strategic partnership with Sui to enhance global access and adoption of the Layer-1 network.
Just weeks prior, Grayscale had launched the SUI Trust to expand the token’s institutional adoption. The protocol also joined hands with xPortal and xMoney to enable a virtual Mastercard rollout across Europe.
Sui network also recently secured its place among the top 10 Layer-1 blockchains, with over $1.74 billion in total value locked (TVL). Notably, the past month alone saw TVL rise by 56%, underscoring growing trust in the ecosystem.
SUI Price Outlook
On the daily chart, SUI is trading within a bull flag pattern. The sharp rally from around $2.60 to $3.80 in late April forms the pole of the pattern, measuring $1.20 in height.
$SUI
Consolidating in a bull flag under resistance.
Lots of potential here. pic.twitter.com/AFV6SuvpCm
— The Wolf Of All Streets (@scottmelker) May 7, 2025
The current consolidation resembles a descending flag structure, with resistance NEAR the $3.50 level. If SUI manages to sustainably break above this line, traders could set the next upside target around $4.70. However, the pattern only remains valid if the token holds above the flag’s lower boundary.
Meanwhile, the RSI is currently sitting around 64, showing that the 11th largest cryptocurrency is nearing the overbought region. Notably, traders should watch any RSI move above 70 for potential divergence, which often leads to reversals.
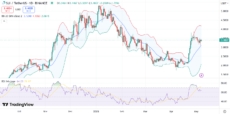
SUI price chart with RSI and Bollinger bands | Source: TradingView
Bollinger Bands suggest SUI remains in an upward bias, as it trades above the mid band (20-day simple moving average) around $3.12. While the token has retreated from the upper band, it’s still within a healthy uptrend channel.
A renewed push to the upper band could indicate another wave of buying pressure. If SUI crosses the $3.50 resistance, it could test the $4.70 region.
nextSUI Price to $5? Bullish Pattern Gives Hopium

Log in to Reply
Log in to comment your thoughtsComments
Related Articles
|Square
Get the BTCC app to start your crypto journey
Get started today Scan to join our 100M+ users