XRP Shatters RSI Ceiling—Is This the Start of a Parabolic Rally?

XRP just punched through its historical RSI resistance—a move that’s got traders scrambling to revise their price targets. The last time this happened, the asset saw a 300% run. Coincidence? Wall Street would say yes (while quietly adjusting their short positions).
Technical breakout or not, one thing’s clear: the crypto markets are ignoring traditional finance’s playbook yet again. When will they learn? Probably around the same time banks stop charging $35 for overdrafts.
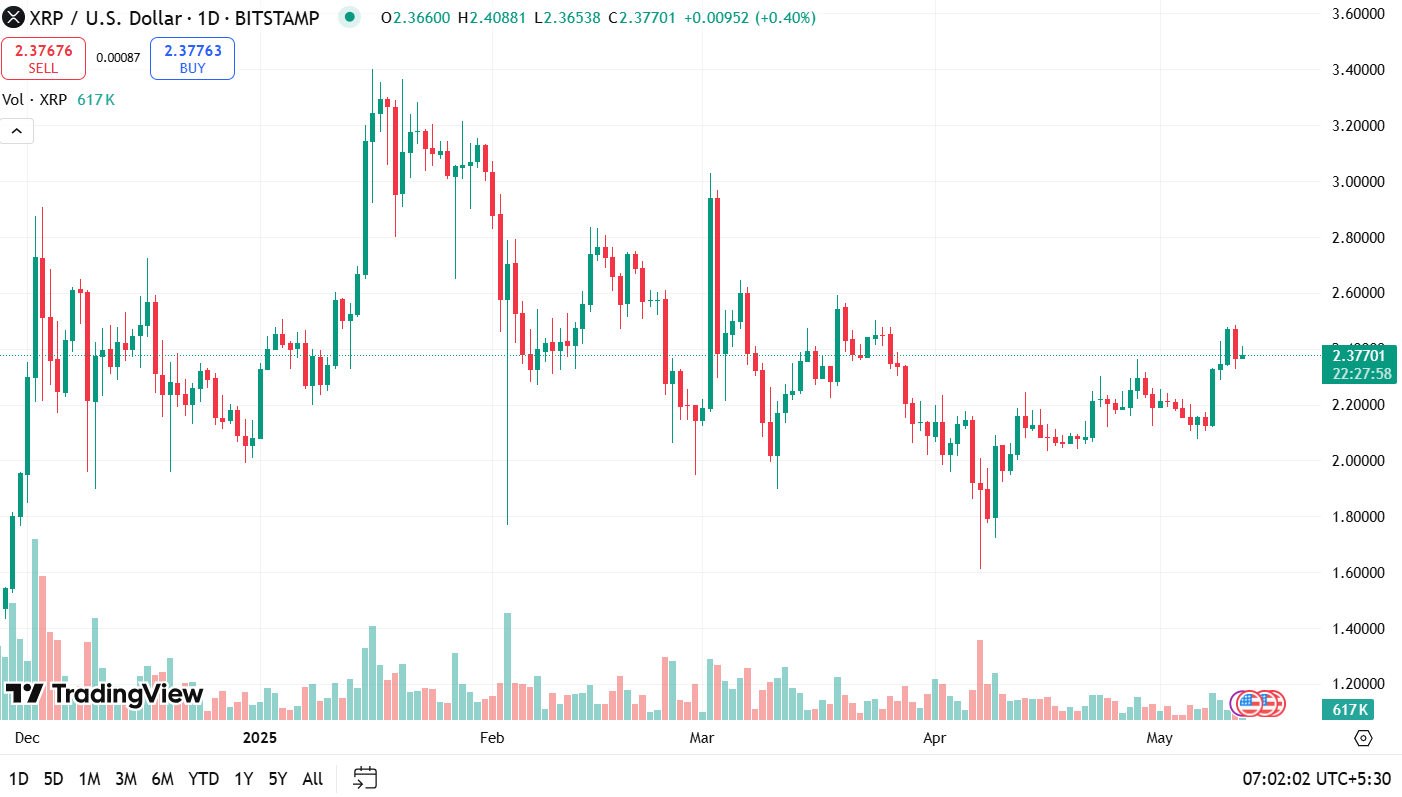
XRP price recorded a slight dip today and is down by more than 1% at the time of writing. According to analysts, XRP is showing early signs of a bullish turnaround and it has also broken above a previous high in Relative Strength Index (RSI). This, according to analyst Josh of Crypto World, could mean the end of the bearish trend. Additionally, if Bitcoin, ethereum and other altcoins also continue to rise, XRP could make a bigger move.
XRP Important Price Targets:
XRP is facing resistance around $2.45 to $2.46, an important level within a downward-trending price channel. While there was an attempt to break through this resistance, a confirmed breakout hasn’t happened yet. Until that happens, short-term resistance is expected to hold.
On the support side, XRP could find short-term buying interest around $2.31 to $2.33. Below that, additional support lies NEAR $2.17, and even stronger support is expected between $2.05 and $2.10 if prices fall further.
XRP Elliott Wave Analysis
A key pattern visible on the chart is a triangle that formed after the 2017-2018 peak. This triangle likely ended with a breakout to the upside, starting a fifth wave that has pushed XRP much higher—an aggressive MOVE that aligns with how these patterns typically behave.
XRP has formed what looks like a five-wave rally from its April 7 low, potentially completing the first wave of a new uptrend. The price recently hit around $2.46, which matches projections. While a further push toward $2.56 or even $2.68 is possible, there’s no confirmation yet that the wave has topped. If the price falls below $2.26, it could signal the start of a corrective wave (wave 2).
