Q2 2025: How Balance Sheets Became the New Crypto Benchmarks

Forget moonshots—Wall Street’s latest obsession is rewriting the rules. Traditional balance sheets are now the crypto industry’s unexpected scorecard, and the numbers don’t lie.
From zero to hero (or zero to bankruptcy)
Quarterly reports used to gather dust in CFO offices. Now? They’re the crypto market’s pulse check—scrutinized like a Bitcoin whitepaper. Liquidity ratios? Suddenly sexy. Debt covenants? The new trading signals.
The irony isn’t lost on anyone. A sector built to disrupt finance now kneels before its spreadsheets—proof even anarchists need accounting. One hedge fund manager quipped: 'Turns out 'decentralized’ doesn’t mean ‘audit-proof.’
Welcome to 2025’s brutal truth: In crypto’s institutional era, the balance sheet isn’t just a statement. It’s the ultimate bullshit detector.
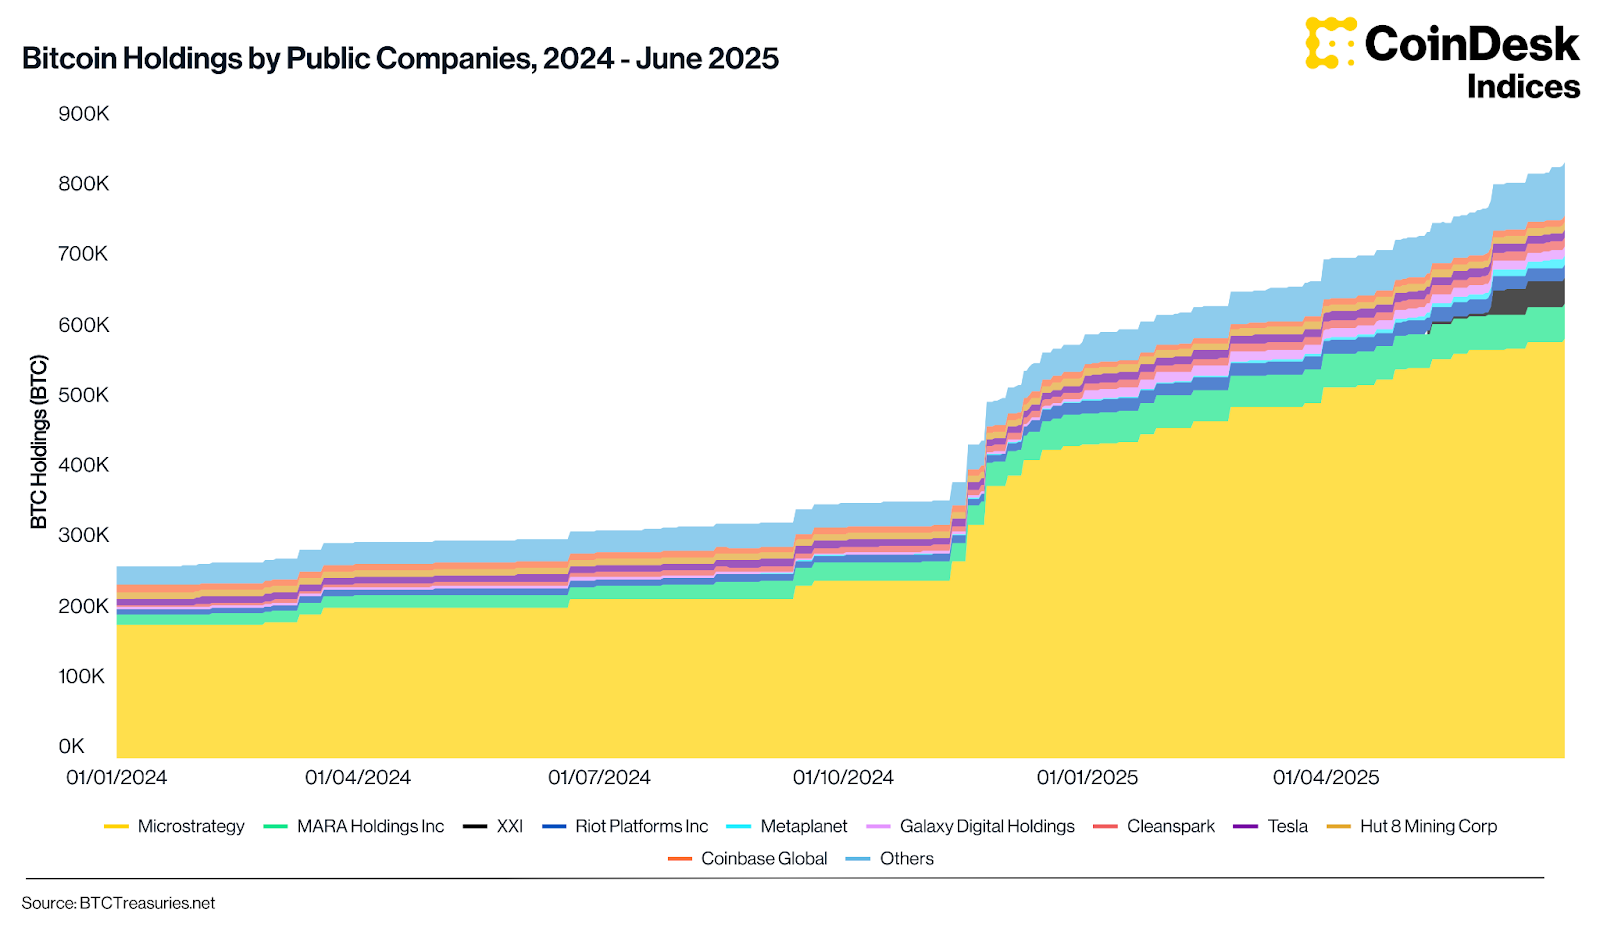
Bitcoin is no longer the only asset benefiting from this trend. Public companies now hold over $1.4 billion in altcoins. ETH accounts for the majority, but firms are increasingly looking beyond the top two. solana has seen corporate accumulation, while TRX, XRP and even BNB are beginning to feature in strategic announcements. Nano Labs, for example, unveiled a $1 billion initiative to accumulate BNB. Meanwhile, Tridentity and Webus.vip are planning substantial capital raises to support XRP buys. This level of activity, previously confined to BTC, is now spreading across the broader market.
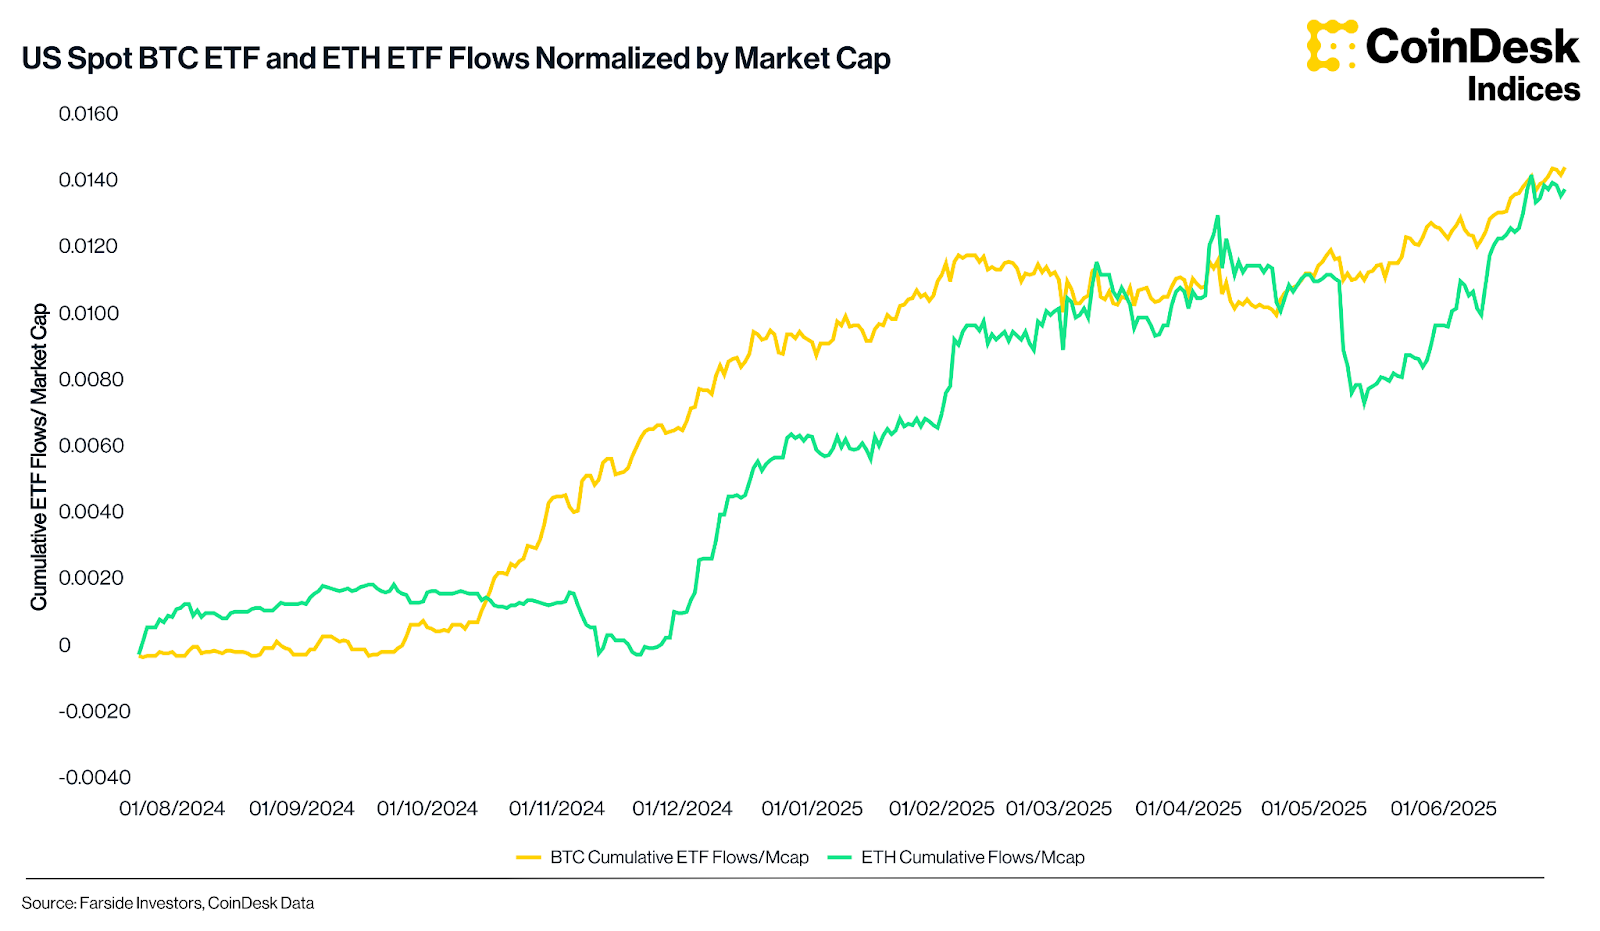
Ethereum, which had lagged in earlier quarters, reclaimed its footing with a 36.4% rise in Q2, CoinDesk Data shows. Flows into ETH ETFs turned positive, and have now remained so for eight consecutive weeks. Adjusted for market cap, these flows are nearly on par with BTC, marking a convergence in sentiment. The 30% uplift in ETH/BTC hinted at a strategic rebalancing, with allocators rotating back into ether.
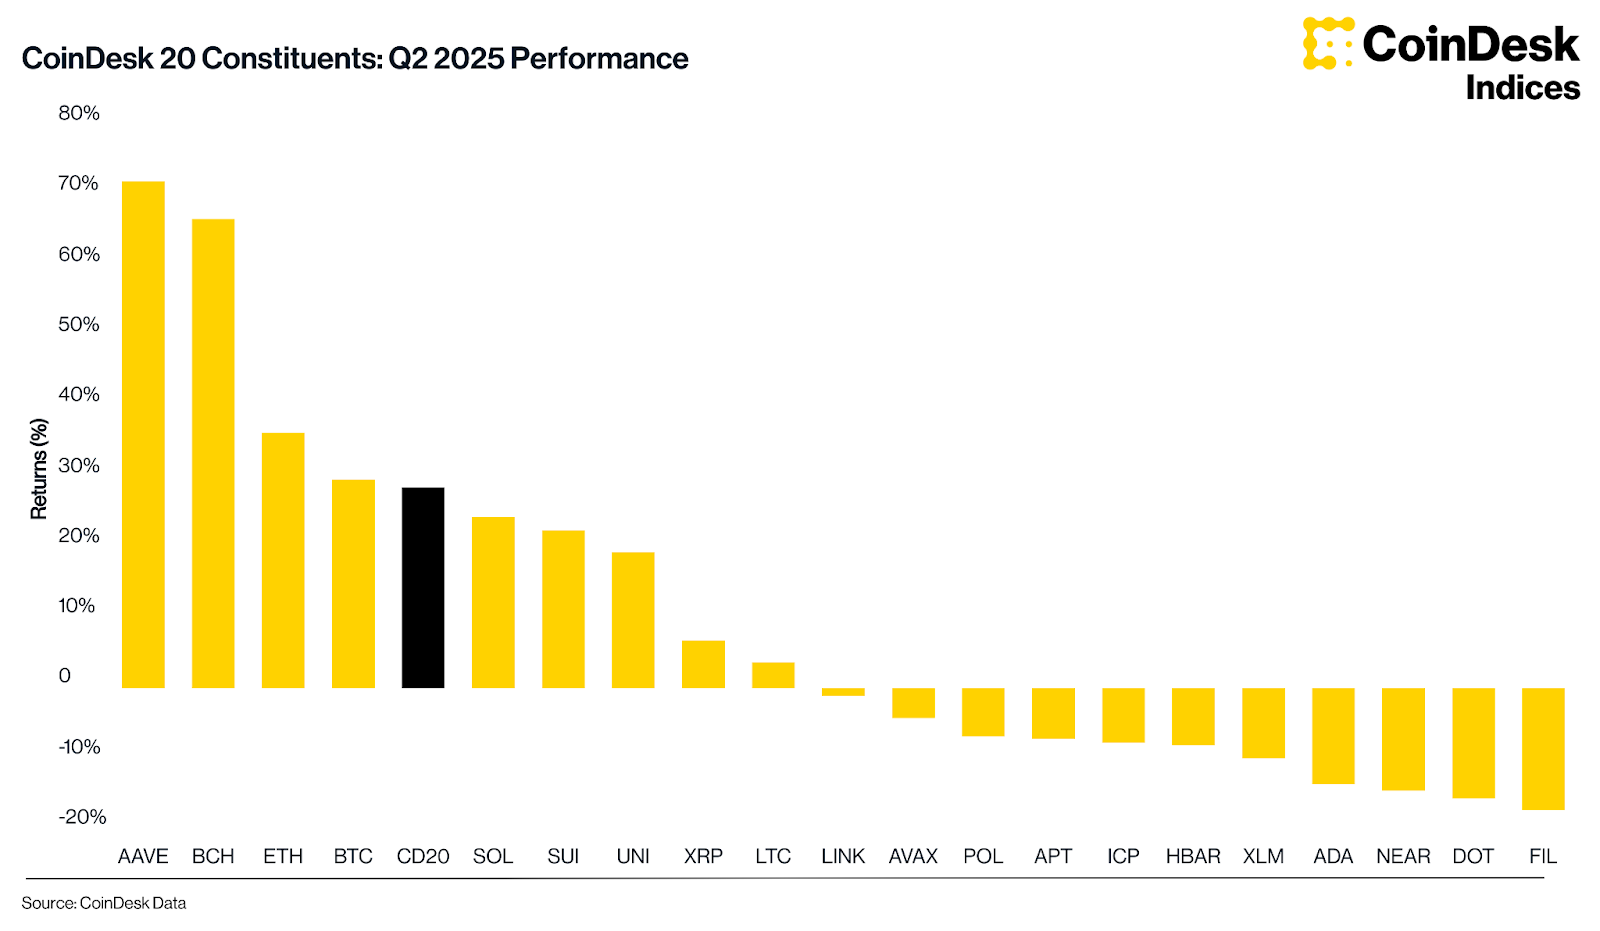
Beyond ETH, AAVE delivered the strongest performance within the CoinDesk 20 Index, gaining 72% in the quarter based on CoinDesk Data, as lending activity hit all-time highs and vePENDLE collateral was added to the protocol. Institutional relevance is beginning to take shape here too. The upcoming Aave v4 upgrade, along with the Horizon initiative aimed at tokenised real-world assets, positions the protocol for greater adoption beyond crypto-native circles.
Solana returned 24.3% in the quarter, according to CoinDesk Data, and retained its position as the leading chain by application-level revenue. However, it underperformed both bitcoin and ether. Despite solid fundamentals, investor flows were directed elsewhere. Capital concentrated in assets with more mature ETF infrastructure and longer-established treasury narratives. Even the launch of the REX-Osprey Solana staking ETF, which attracted $12 million on its debut trading day, was not enough to reignite momentum.
That said, investor interest is still building. The recent Pump.fun token generation event is drawing attention from both ends of the spectrum. On one side are speculative participants, while on the other are value-driven investors assessing the project’s revenue potential. Treasury activity also continues to rise, with over one million SOL now held by corporations such as SOL Strategies and DeFi Development Corp.
The second quarter confirmed what the first quarter had suggested: leadership in digital assets is narrowing, and the market is rewarding clarity. The CoinDesk 20 Index ROSE by 22.1%, although only four constituents outperformed it: Aave, bitcoin cash, ether and bitcoin. The CoinDesk 80 declined by 0.78%, while the CDMEME Index ended the quarter up 27.8% despite a 109% spike in May (based on data from CoinDesk Indices). Outside the majors, most assets lacked consistent inflows or structural support, leaving them prone to retracements.
Bitcoin and ether both saw their index weights decline by over five percentage points. This made space for assets that posted stronger returns, but it did not meaningfully change the composition of leadership. Aave and BCH still represent a small fraction of the index, reflecting the reality that outperformance alone is not enough to shift structural weightings. Liquidity and credibility remain prerequisites.
As adoption broadens and corporate behaviour becomes more material to price action, benchmarks are playing a more active role in capital decisions. With more than $15 billion in cumulative trading volume since launch, the CoinDesk 20 is now both a measure of market direction and a foundation for building structured exposure.
The rally in Q2 was real, but more importantly, it was orderly. Allocators are not trend-chasers. They are building frameworks. Benchmarks, indices and ETFs are at the centre of this evolution. As digital assets MOVE from the edges of portfolios to their core, tools that bring discipline and structure become increasingly important.
For full performance details and constituent analysis, you can explore the Q2 Digital Assets Quarterly Report.
Disclaimer: All price, index and performance figures references are sourced from CoinDesk Data and CoinDesk Indices unless stated otherwise.
