Worldcoin Eyes $4.00 Milestone as Symmetrical Triangle Breakout Gains Momentum

Worldcoin teeters on the edge of a major technical breakout—traders are watching every tick.
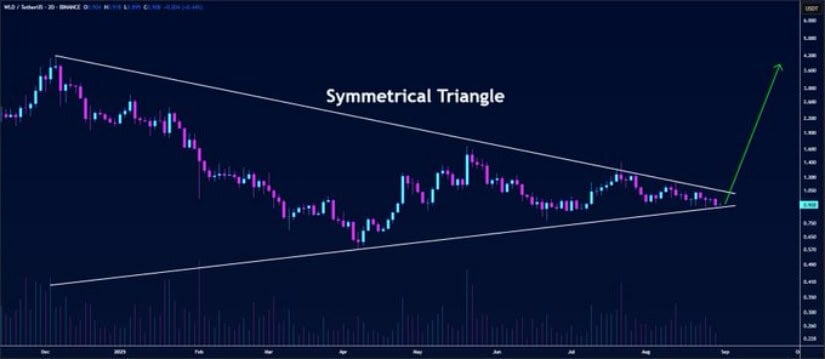
The Pattern That's Got Everyone Talking
That symmetrical triangle formation isn't just pretty chart art—it's a coiled spring. Price action's been squeezing tighter than a traditional banker's grip on legacy finance systems. Each bounce off support gets shallower; each rejection at resistance weakens. The math's simple: something's gotta give.
Why $4.00 Matters More Than You Think
Hitting that target isn't just about round numbers. It represents a clean 100% extension from the pattern's anchor point—the kind of move technical traders live for. Break through, and you trigger a cascade of stop orders and FOMO buys. Fail, and well... let's just say crypto Twitter gets interesting.
The Cynic's Corner
Because nothing says 'sound monetary policy' like digital tokens named after planetary concepts while actual planets burn. But hey—the chart looks good.
Next moves? Watch volume on the breakout. Real moves come with conviction; everything else is just noise.

Technical analysis of recent charts highlights a tightening price range and balanced market sentiment, setting the stage for a potential breakout that could send the memecoin surging toward the $4.00 mark.
Traders and investors should be alert to volume shifts and price movements in the days ahead, as these may confirm the next major directional move.
Symmetrical Triangle Signals Incoming Breakout
The primary technical setup is a classical symmetrical triangle observed on the 2-day (2D) timeframe, illustrating WLD price compression between converging support and resistance trendlines.
This pattern reflects an equilibrium between buyers and sellers, each unable to decisively take control, resulting in decreasing volatility and range. As the price approaches the triangle’s apex, momentum is expected to build, potentially triggering an explosive breakout.
Source: X
Historically, breakouts from such symmetrical formations can lead to significant price movements. The breakout direction, whether upward or downward, depends on market momentum at the time of resolution.
In WLD’s case, the bullish scenario remains prominent, with a projected upper target near $4.00 once momentum accelerates. Traders are advised to watch for volume increases during the breakout, as strong volume WOULD validate the strength and sustainability of the price move.
Market Trend Reflects Cautious Optimism Amidst Volatility
Additionally, BraveNewCoin’s data reveals that WLD price has fluctuated modestly within a narrow $0.85 to $0.91 range over the past 24 hours, settling NEAR $0.88. Although daily volume, approximately $115.73 million, shows moderate liquidity, a slight decline compared to previous periods suggests cautious trading and slightly diminished buying interest.
Despite this, the recent small uptick in price hints at a potential trend reversal from earlier selling pressures.
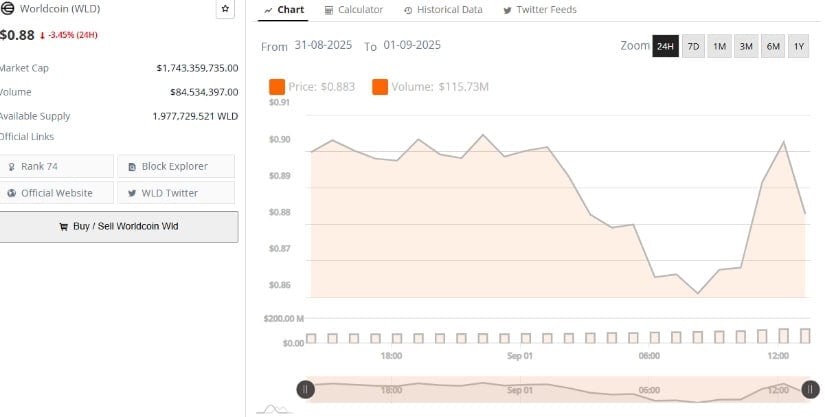
Source: BraveNewCoin
This price action indicates a tentative balance between bulls and bears. A decisive break above the $0.91 resistance level, coupled with rising volume, could confirm growing bullish enthusiasm and align with the breakout scenario forecasted by the symmetrical triangle pattern.
Conversely, subdued volume and failure to clear resistance may prolong consolidation or lead to downward pressure. As such, monitoring volume trends and potential catalysts will be vital in assessing upcoming price directions.
Momentum Indicators Show Breakout Prospects Remain
On the technical indicators front, TradingView charts of WLD’s MACD and Chaikin Money FLOW (CMF) suggest that bearish momentum currently weighs on the price.
The MACD displays a negative histogram with the MACD line sitting below its signal line, though it remains in a neutral zone rather than an entrenched decline. The CMF, indicating market money flows, is also negative, signaling that distribution slightly outweighs accumulation at present.
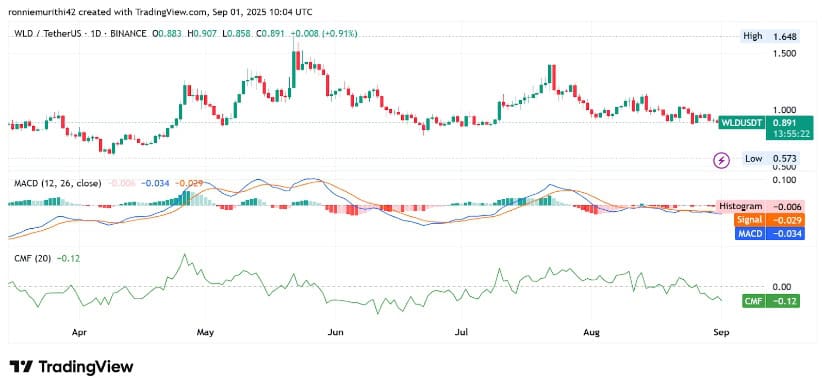
Source: TradingView
Despite these indications of short-term selling pressure, the overarching setup from the triangle maintains a bullish context. Should a breakout occur supported by increased trading volume, both the MACD and CMF could reverse course and confirm a new upward trend.
Traders should watch closely for a bullish MACD crossover, which may coincide with the breakout and signal entry points for potential gains.
