Stellar Nears Explosive Breakout as Wedge Pattern Tightens

Stellar's consolidation phase reaches its climax as technical patterns signal imminent volatility.
Wedge Formation Reaches Critical Point
The narrowing wedge pattern suggests building pressure that typically precedes significant price movements. Traders watch for the pattern's resolution—either upward breakout or downward rejection—as volume indicators begin to show increased activity.
Market Mechanics Favor Bullish Resolution
Historical data indicates narrowing wedges often resolve in the direction of the preceding trend. With Stellar maintaining key support levels, the technical setup favors upward momentum—though as any seasoned trader knows, patterns sometimes break just to punish overconfident chart readers.
Institutional interest in cross-border payment solutions continues to drive fundamental value propositions, while technicals suggest the market might actually move before the next quarterly report from another crypto fund that'll probably underperform the market anyway.

Analysts note that the cryptocurrency structure is tightening as it approaches a critical point. Litecoin, by comparison, faces its own technical setup, but the asset remains the focal point as accumulation continues near the mid-range.
Charts Highlight Stellar’s Long-Term Compression
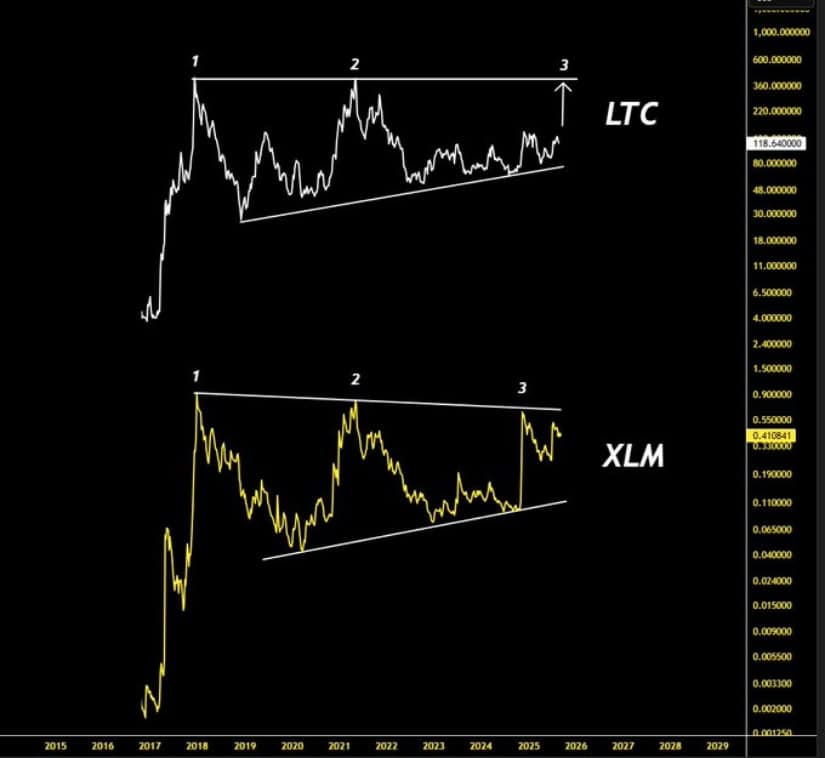
A recent X chart shows the memecoin is locked inside a symmetrical wedge that has been developing since 2017. This structure is defined by gradually lower highs on the upper boundary and a rising base of higher lows. Together, these forces have squeezed price action into a narrowing band that traders typically view as a sign of an impending breakout.
Source: X
From the analyst’s perspective, the wedge’s upper ceiling NEAR $0.90 is the key barrier to watch. The asset has tested this zone multiple times, most recently aligning with its broader recovery phases, but has yet to secure a decisive close above it. Each rejection has forced the token back into consolidation, but importantly, the series of higher lows has kept the bullish structure intact.
Litecoin’s ascending triangle, noted by Master (@MASTERBTCLTC), provides a parallel in market behavior, but the coin’s wedge is even more significant in duration and scope. A sustained push beyond $0.90 WOULD confirm a breakout and could mark the beginning of a fresh rally cycle for the cryptocurrency. Until then, traders expect the market to oscillate within the wedge as it builds momentum.
Stellar Macro Pattern Signals Approaching Breakout Zone
Stellar’s long-term price action forms a symmetrical wedge pattern starting from its 2017 price peak, as reported by BraveNewCoin. Unlike LTC’s horizontal resistance, this wedge’s upper boundary slopes downward, causing price rallies to face progressively lower highs. At the same time, the support trendline slopes upward, creating a compression of price within the wedge pattern.
Source: BraveNewCoin
Currently trading near $0.36, the token sits closer to the middle of this wedge territory but is edging toward an important breakout point near the $0.90 resistance. Breaking above this level would mark the memecoin’s most significant bullish advance in years and could open the door for a run toward its 2018 highs. On the downside, failing to hold key support between $0.20 and $0.25 risks prolonging the consolidation phase, delaying any meaningful uptrend.
Short-Term Indicators Show XLM in Consolidation Amid Weakening Selling Pressure
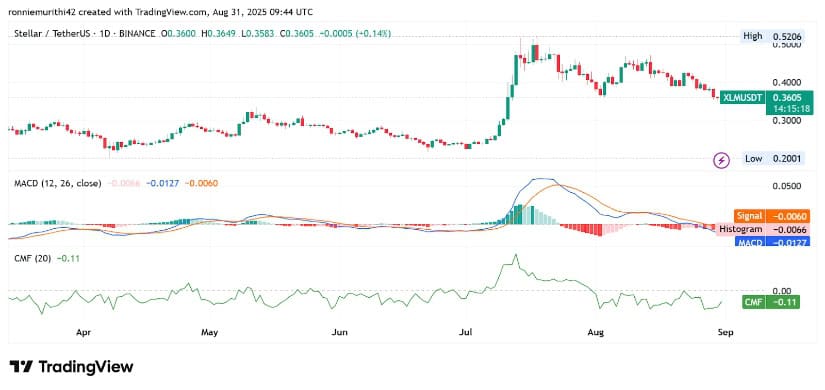
Daily XLM price action, as monitored on TradingView, reveals a consolidation phase following a strong rally that peaked at approximately $0.52 in July. The MACD indicates ongoing bearish momentum with its line (-0.0127) and signal (-0.0060) both remaining in negative territory, but the narrowing histogram bars suggest weakening selling pressure.
Source: TradingView
The Chaikin Money FLOW (CMF) indicator also reflects modest capital outflows at -0.11, indicating that while selling exists, it is not overwhelming. Price recently found support around $0.30 to $0.32, establishing a higher low relative to the June base near $0.20, which signals underlying accumulation despite the recent pullback.
If buyers regain control and push the memecoin above the $0.40 mark, bullish sentiment is likely to strengthen. Conversely, a breakdown below $0.30 could trigger a test of the lower $0.25 support zone, challenging the ongoing consolidation.
