Solana Price Prediction: SOL Targets $245 Breakout as Golden Cross and ETF Hype Converge

Solana's charging toward a major momentum shift—technical patterns align with speculative frenzy to create the perfect bullish storm.
The Golden Cross Arrives
SOL's 50-day moving average slices through the 200-day, flashing a classic buy signal traders haven't seen in months. That golden cross typically precedes extended rallies—and this one's got extra fuel.
ETF Buzz Goes Mainstream
Wall Street's suddenly whispering about Solana ETF possibilities, because nothing gets traditional finance excited like repackaging something they previously ignored into a fee-generating product. The speculation alone could push SOL past that $245 resistance level.
Breakout Imminent
All signs point toward explosive movement. Technicals support it, narrative fuels it, and the market's hungry for the next big crypto story. Whether this becomes sustained growth or another 'buy the rumor' moment remains to be seen—but momentum doesn't wait for skeptics.

After weeks of building pressure, Solana price is now sitting right at the edge of a potential breakout. The $220 resistance has become the market’s focal point, and with a golden cross flashing on the daily chart, participants are watching closely to see if momentum finally shifts in favor of the bulls.
Solana Price Action Strengthens With Golden Cross
Solana is pressing against the $220 resistance while flashing a key bullish signal on its daily chart, the SMA-50 crossing above the SMA-200, forming a golden cross. This alignment is often seen as a sign of shifting long-term momentum, and in Solana’s case, it comes as price rides the upper boundary of a rising channel. With buyers consistently defending higher lows, the breakout point is drawing closer, and the golden cross adds confidence that trend momentum is strengthening.
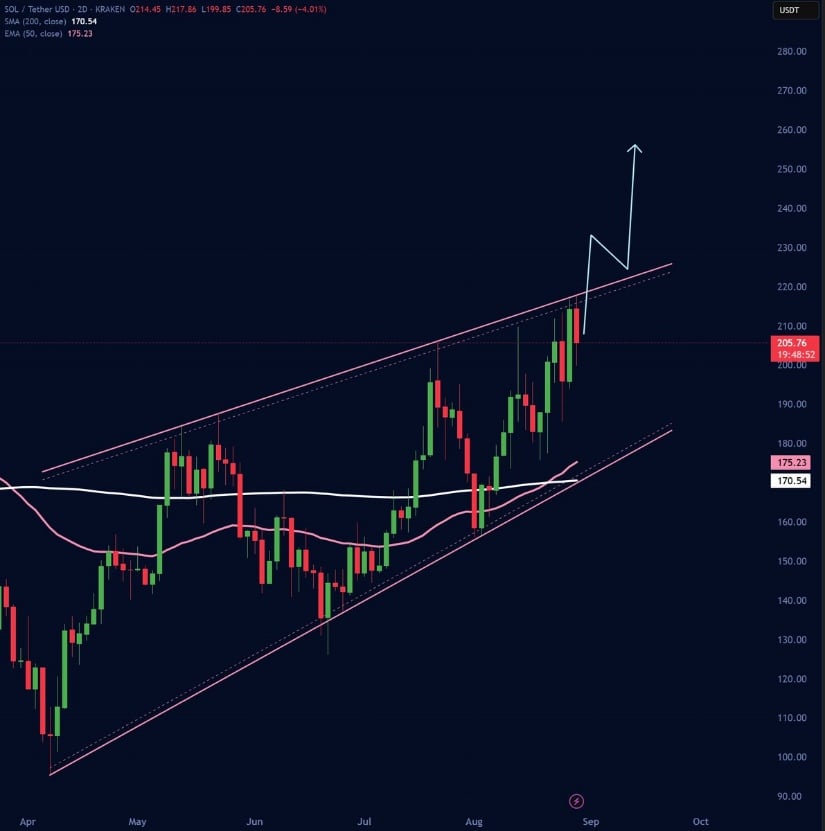
Solana’s golden cross highlights strengthening momentum as it challenges the $220 resistance zone. Source: Jesse Peralta via X
From Jesse Perelta’s view, clearing $220 with conviction could flip this level into fresh support and open the door towards the $240 to $245 range. Failure to hold the breakout, however, might send the price back to retest the channel midline around the $200 area. With the golden cross now in play, market participants are closely watching whether solana can translate this momentum into a trending breakout.
ETFs Could Act as a Major Trigger
Adding to Solana’s strong developing technicals, fresh developments around ETFs could provide the kind of external catalyst that pairs neatly with the recent golden cross. Nine different Solana ETF filings are lined up, including from major issuers like Grayscale, VanEck, and Fidelity, with approval deadlines approaching later this year. ETFs have already had a positive impact on Bitcoin and ethereum lately, and once SOL gets exposure to ETFs its likely to go down in a similar path.
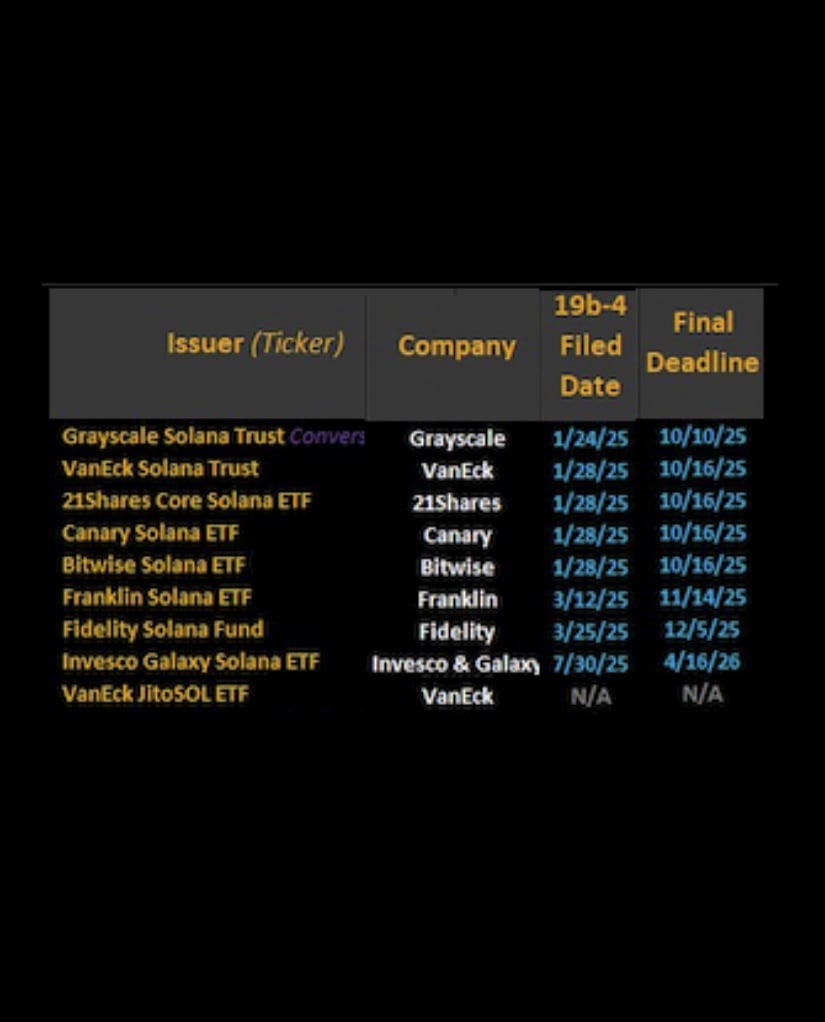
Solana ETF filings from major issuers like Grayscale, VanEck, and Fidelity could act as the catalyst for a breakout beyond $220. Source: Curb.Sol via X
In the context of Solana pressing the $220 breakout zone, the timing of ETF approvals could act as a trigger. A successful breakout paired with ETF headlines might accelerate momentum toward the $240 to $245 range.
Institutions Keep Adding to Solana
Fresh data shared by Jesse Peralta shows Solana holdings by public companies surging past $900 million, an exponential climb that reflects growing institutional conviction. This kind of steady accumulation confirms that large entities are not only paying attention but actively positioning.
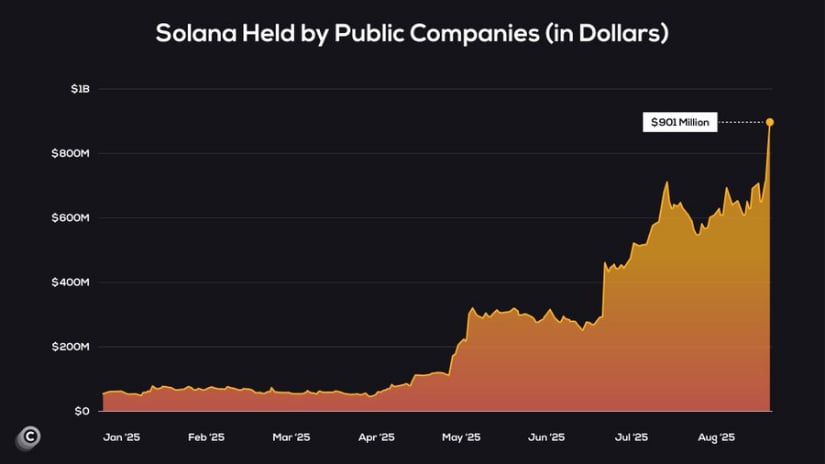
Institutional holdings of Solana have surged past $900M, signaling strong conviction ahead of potential ETF approvals. Source: Jesse Peralta via X
What stands out here is how this trend ties back to the pending ETF approvals. If public companies are already driving such strong inflows, the acceptance of Solana ETFs could unlock even larger waves of capital from asset managers and funds. Combined with the $220 breakout test and the golden cross momentum highlighted earlier, institutional participation looks set to lead to a bullish solana price Prediction.
Solana Price Closes In on Breakout Zone
SOL Solana price is pressing right against the $205 to $206 neckline, where weekly resistance continues to cap upside. The inverse head and shoulders structure is visible, with the head anchored around $199 support and the right shoulder now driving price back into the neckline. Holding above $200 has kept the setup alive.
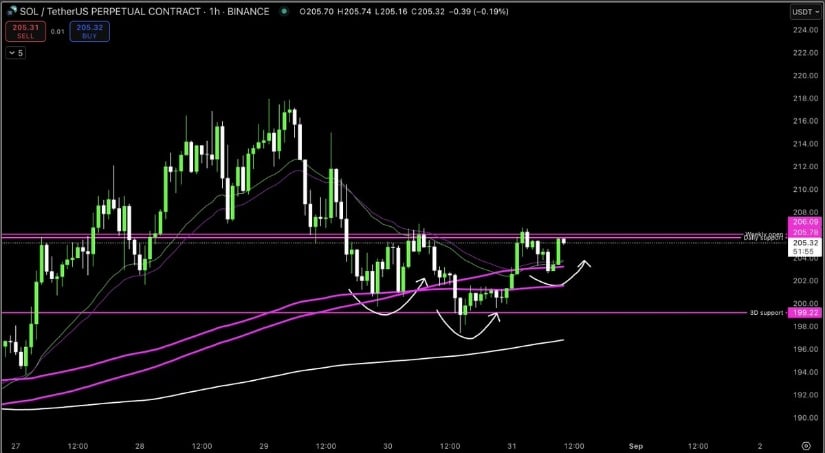
Solana is testing the $205–$206 neckline, with an inverse head and shoulders pattern hinting at a potential breakout. Source: CRG via X
A clean push through $206 WOULD shift focus towards $212 to $215, with a broader extension into the $225 to $230 region if momentum holds. For now, $199 remains the key downside level, but the market is leaning towards testing higher levels as pressure builds at the neckline.
Cautious View: MACD Bearish Divergence Emerges
On the 4H chart, Solana price is flashing a bearish divergence as price holds a rising trendline while the MACD histogram trends lower. This mismatch between higher price action and weakening indicator momentum often signals that strength is fading beneath the surface. With resistance levels already proving sticky, the divergence could lead to a drop in strength.
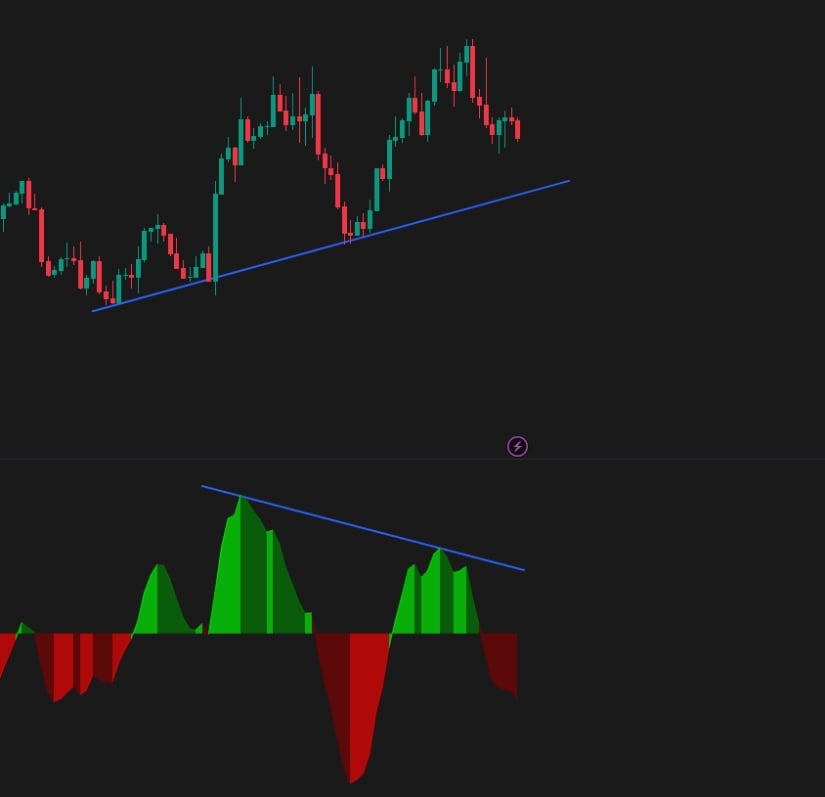
Solana’s 4H chart shows a bearish MACD divergence, hinting at fading momentum. Source: TradingClub via X
Crypto analyst TradingClub believes that this divergence could serve as an early warning for a dip back towards the $200 region if buyers fail to maintain pressure.
Final Thoughts
Solana’s setup is one of the more interesting in the market right now, combining strong technical momentum with clear external catalysts. The golden cross, institutional inflows, and pending ETF approvals all converge to suggest upside potential, but short-term signals, such as the MACD divergence, remind traders that caution is still warranted. Whether SOL clears $220 and transforms it into solid support will likely dictate the direction for the next leg.
For participants, SOL’s $220 breakout zone is the key battleground; above it, momentum could quickly accelerate into the $240 to $245 range, while a failure to hold may trigger a retest of the $200 support level.
