WIF Market Signals Intensify as Elliott Wave Pattern Hints at Imminent Rally Surge

WIF's technical setup flashes bullish as Elliott Wave theory signals potential breakout momentum.
Pattern Recognition
The wave structure completes its corrective phase—traders now eye the next impulsive move upward. Classic five-wave patterns suggest accumulation happening beneath the surface.
Market Psychology
Retail FOMO hasn't kicked in yet, but savvy players position early. They know these patterns rarely wait for consensus—just like traditional finance, only faster and with fewer suits involved.
Timing the Move
Wave projections point toward decisive action rather than slow grinds. When these setups resolve, they tend to do so with conviction—cutting through noise and bypassing hesitant traders altogether.
Another reminder that charts sometimes outperform fundamentals—until they don't.

A close examination of Elliott Wave counts, market liquidity, and momentum indicators reveals a mixed but cautiously optimistic outlook. The token appears to be building a foundation for the next impulsive wave, contingent on key resistance breakouts and support holds.
Elliott Wave Structure Suggests Possible Impulsive Move
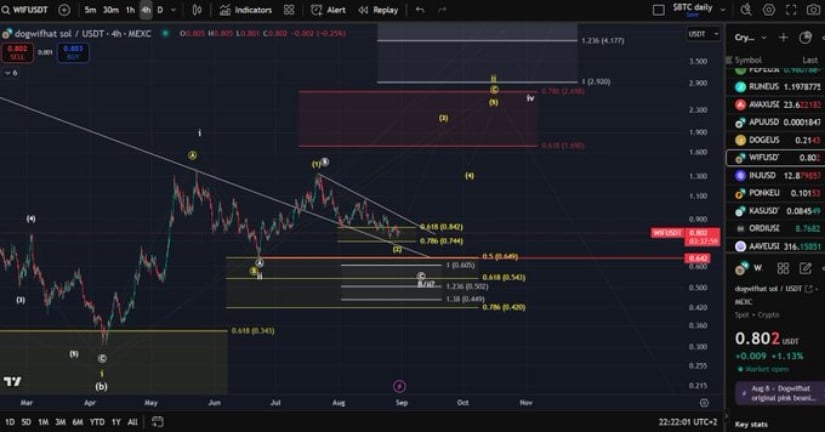
Detailed analysis from Manofbitcoin charts WIF moving within an Elliott Wave corrective sequence, oscillating between wave (1) and wave (2). The highlighted yellow wave structure hints at a foundational stage for the next major impulsive wave, contingent on buyers stepping in decisively.
However, a WHITE alternate scenario warns of possible further downside, emphasizing the necessity of confirming a clear bottom.
Source:X
A descending trendline currently acts as a significant resistance barrier. Breaking above this line WOULD be the first technical signal that wave (3) is underway, potentially triggering momentum that targets Fibonacci extension levels beyond $1.20, even up to $1.40. Until such a breakout materializes, the asset remains locked in consolidation with sellers exerting control in the short term. Crucial support resides in the $0.78–$0.74 zone, aligning with Fibonacci retracement levels, which could act as a springboard if defended successfully. Breaching this support, however, could invalidate the immediate bullish scenario and extend corrective pressure.
Market Data and Liquidity Indicate Active Participation
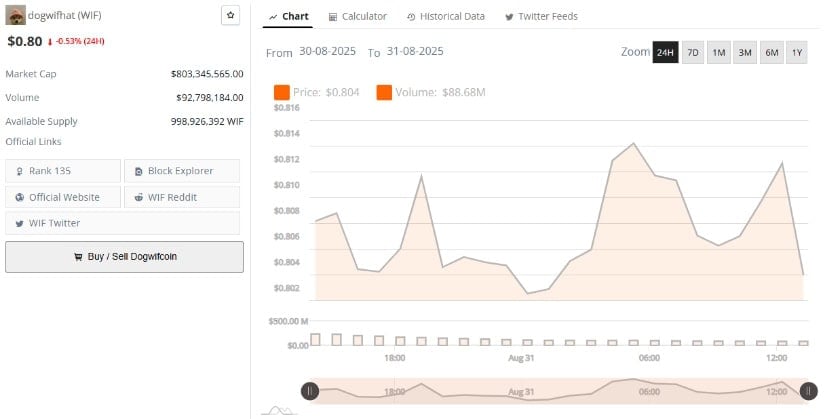
Real-time data from BraveNewCoin shows WIF trading NEAR $0.80, posting a mild daily decline of around -0.53%. Notably, trading volumes are robust at $92.7 million, signaling active engagement from both retail and institutional buyers. With a market capitalization of $803 million, he token sits solidly as a mid-cap asset, offering ample liquidity favorable for speculative movements.
Source: BraveNewCoin
Price action within the last 24 hours fluctuated between $0.802 and $0.816, underscoring intraday volatility in a narrow range. This consolidation phase reflects a balance of power between buyers and sellers at micro-support levels, often preceding significant directional shifts.
Nearly 999 million tokens are in circulation, providing widespread market distribution but also making the memecoin susceptible to notable price swings on demand surges or sell-offs. Traders should monitor volume spikes closely, as these often precede breakout moves and directional confirmations.
Technical Indicators Demonstrate Mixed Momentum Signals
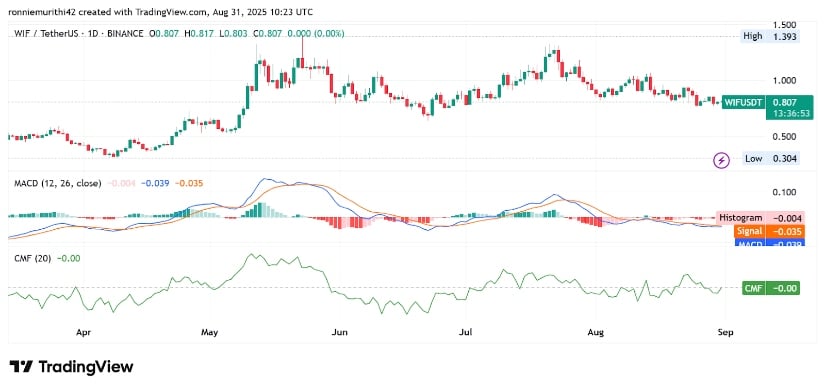
The daily candlestick chart on TradingView places WIF’s current price near $0.807, following a peak of $1.39 earlier this year.
Despite the subsequent consolidation, the token remains well above long-term support levels around $0.30, underscoring resilience in its overarching trend. While short-term momentum indicators are subdued, the broader market structure remains constructive.
Source: TradingView
The MACD indicator portrays caution, with both the MACD and signal lines positioned below zero and a slightly negative histogram, highlighting tepid buying pressure. This implies that though the groundwork for bullish continuation exists, momentum has yet to realign positively. A bullish MACD crossover would be a significant confirmatory sign for recovery.
The Chaikin Money Flow, hovering near the neutral zero line, reflects a balance between capital inflows and outflows, emphasizing market indecision. A push into positive territory would signal stronger accumulation and growing bullish sentiment. Key levels to watch include resistance near $0.90 and critical support at $0.78, which could determine the token’s next directional move.
