Stellar Teeters at $0.33 Support as Bearish Pressure Mounts - Here’s What Comes Next

Stellar's foundation cracks as selling pressure intensifies—all eyes lock onto that critical $0.33 support level.
Market Pulse: Red Dominates
Traders scramble while bears tighten their grip. The charts don’t lie—momentum’s shifting, and not in Stellar’s favor.
Support or Surrender?
A breach below $0.33 could trigger another leg down. Nobody’s panicking yet, but let’s be real—this isn’t the 'stable store of value' brochure talk either.
Just another day in crypto—where 'fundamentals' sometimes take a backseat to sheer sentiment.

Analysts suggest that the $0.33–$0.35 range is now in focus as traders await the next decisive move.
Weekly Chart Signals Downside Risk
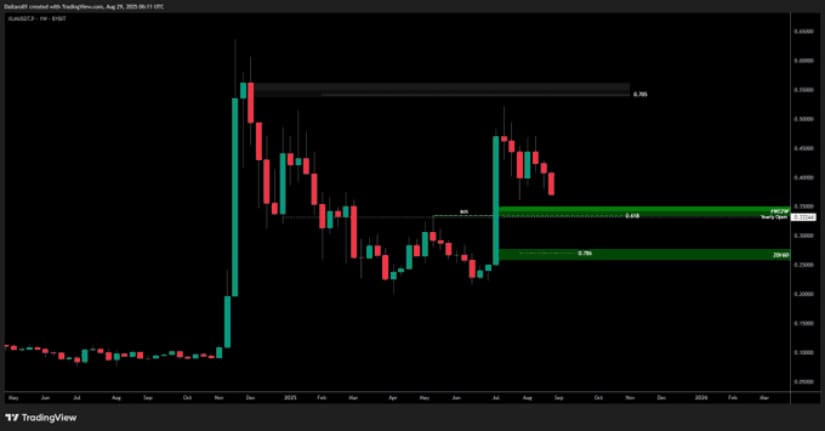
Analyst Daitaro (@Daitaro01) highlighted the $0.33–$0.35 zone as a key level for XLM. His weekly chart shows price rejection NEAR the $0.50 area, where supply outweighed buying demand. Since then, the digital asset has formed lower highs, a signal of sustained bearish momentum.
Source: X
The green support zone aligns with Fibonacci retracement levels, making it an area where buyers may step in. A successful defense could stabilize price action, while a breakdown risks a slide toward $0.28. This puts the market at a crossroads where holding above $0.33 is critical for maintaining a broader bullish bias.
Market Data Reflects Caution
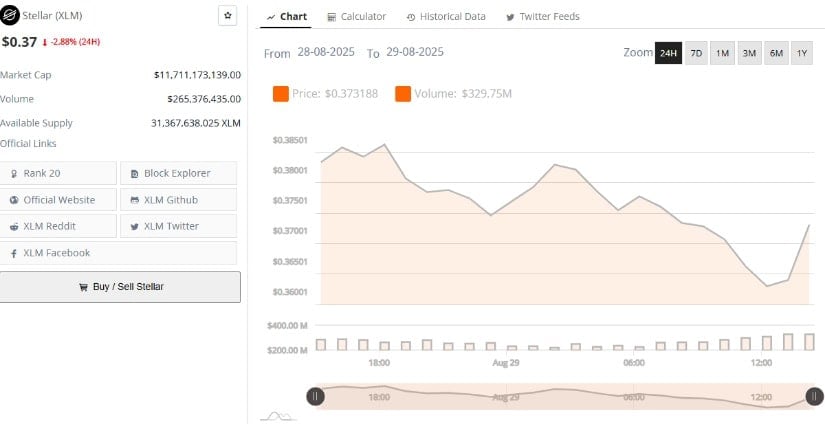
According to data from Bravenewcoin, XLM trades at $0.373, marking a 2.88% daily decline. Market capitalization stands at $11.7 billion, while 24-hour volume has dropped to $265 million. This decline in volume compared to early August suggests reduced trading activity and waning demand.
Source: BraveNewCoin
The 24-hour chart shows price fluctuations between $0.36 and $0.38. Although the digital asset remains in the top 20 cryptocurrencies, the narrowing price range points to indecision. Traders appear to be waiting for stronger signals before committing to large positions.
Daily Indicators Point to Weakness
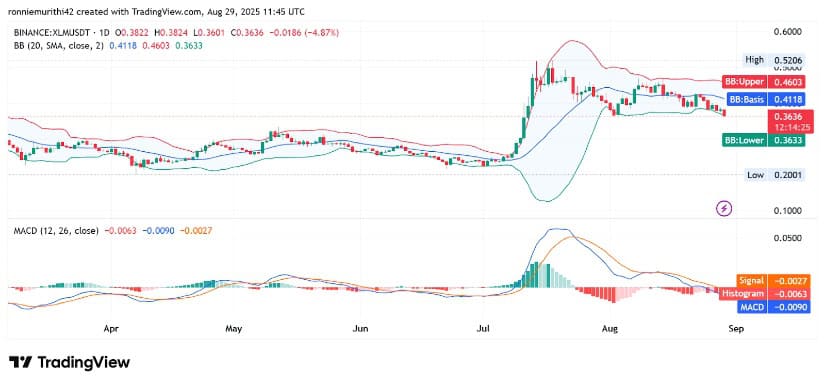
On TradingView, the daily chart shows the asset hovering at $0.3634, close to the lower Bollinger Band ($0.3632). This indicates that the coin is entering oversold territory, which may provide a short-term bounce opportunity. However, volatility remains elevated, with wide Bollinger Bands reflecting uncertainty.
Source: TradingView
The MACD (12, 26) remains bearish, with the histogram at –0.0064. A bearish crossover has formed, where the signal line is above the MACD line, reinforcing short-term weakness. For any meaningful recovery, the asset must reclaim the middle Bollinger Band ($0.41) and flip it into support.
The technical indicators shows the token at a decisive level. If the $0.33–$0.35 support holds, it could act as a launchpad for a relief rally. A rebound may initially target $0.41, with stronger resistance at $0.45 and $0.50.
Failure to hold this range, however, could open the path to $0.28, a deeper retracement level. Analysts warn that traders should monitor both volume and momentum indicators closely to gauge sentiment shifts.
Outlook for Stellar
In the near term, the asset faces pressure as momentum indicators lean bearish. However, oversold signals suggest the possibility of short-term relief. The balance between these opposing signals will determine whether cryptocurrency stabilizes or extends its decline.
Long-term holders may see the $0.33 zone as a key accumulation area, but short-term traders face uncertainty. Until momentum shifts, the memecoin outlook remains tied to whether it can defend its critical support levels.
