SEI Defends $0.30 Support: Analysts Target $0.60 Breakout as Momentum Builds

SEI bulls dig in at critical support—traders eye explosive 100% rally potential.
Defending the Line
SEI's holding firm above that crucial $0.30 level, shaking off market jitters like a seasoned pro. Analysts spot textbook consolidation patterns—the kind that often precede major moves.
Rally Triggers
Breaking resistance around $0.35 could unleash momentum targeting the $0.60 zone. Volume patterns suggest accumulation, while derivatives data shows growing bullish positioning.
Risk Management
A decisive close below $0.30 invalidates the thesis—typical crypto 'support until it isn't' theater. Smart money watches for false breakdowns before committing.
Another day, another token promising life-changing gains—because what's finance without a little hopium between reality checks?

Technical signals are starting to show early improvements, prompting analysts to monitor the market closely for signs indicating the beginning of a rally. Discussions among experts now increasingly suggest the possibility of a move toward $0.60, which WOULD represent considerable upside potential from present levels.
Price Stability Signals Potential Upside
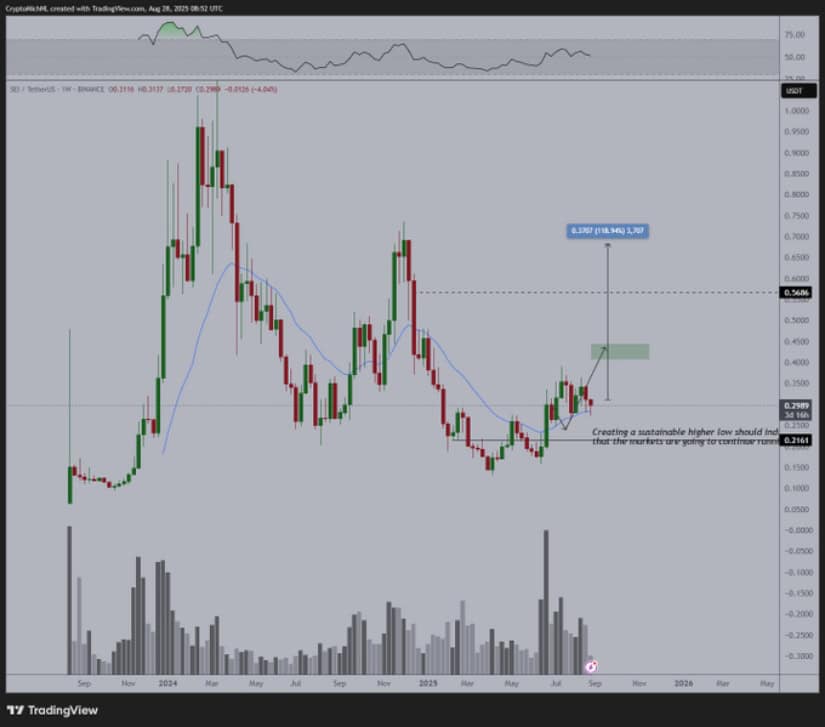
The medium-term technical outlook is improving, with the weekly charts for SEI showing a clear bounce from a critical support level NEAR $0.21. This recovery has contributed to the formation of a higher low pattern, which is a positive sign that buying interest is returning to defend essential price zones.
Source: X
Accompanying this is a marked increase in trading volume, which reflects renewed market participation and investor confidence. Such a combination of factors is often a precursor to stronger price action in the following weeks.
Holding above the $0.25 price point is particularly important to confirm this bullish arrangement. A weekly closing price above $0.35 could attract momentum traders, potentially accelerating price action and pushing it toward the $0.45 to $0.60 range. This would indicate a shift in market structure toward an upward trend. Analysts note that sustained buying interest at these support levels plays a vital role in maintaining this positive momentum.
Intraday Price Activity Reflects Cautious Optimism
On a shorter time frame, Sei Price movements over the last 24 hours have oscillated largely between the $0.285 and $0.305 range.
Buyers have actively defended the support around $0.29, which has helped maintain price stability amid broader market fluctuations. Market capitalization currently hovers around $1.8 billion, supported by a solid trading volume between $207 million and $216 million, demonstrating consistent liquidity and investor interest.

Source: BraveNewCoin
The price rebounded close to $0.302 during late trading sessions, suggesting that dip-buying remains prevalent among traders and investors. This behavior aligns with the expectation that consolidation at current levels may create a launchpad for a subsequent upward push.
If the price can remain stable above this threshold, it may set the stage for advancing toward resistance levels in the $0.35 to $0.40 zone, marking a continued positive trajectory in the short term.
Daily Technical Indicators Suggest Corrective Phase
On a daily timeline, the SEI price has been hovering near $0.29, encountering some selling pressure as indicated by price action around the mid-band of the Bollinger Bands, located at approximately $0.314.
Meanwhile, the lower Bollinger Band at $0.278 serves as immediate support, preventing further short-term declines. The rejection of prices at the mid-band reflects ongoing but mild bearish momentum.

Source: TradingView
Additional technical signals from the Moving Average Convergence Divergence (MACD) indicator highlight a weak bearish trend. The MACD line currently remains below the signal line with a negative histogram, supporting the view that the asset is undergoing a corrective phase rather than entering a full downtrend.
This sets the stage for a potential recovery if the price can reclaim the $0.32 level and hold above it. Should buying pressure build sufficiently, a rally toward $0.35 could materialize. Conversely, failure to sustain support near $0.28 might lead to a retest of lower levels, possibly around $0.25.
