Dogwifhat Price Prediction: Bullish Breakout Could Propel $WIF to $1.34

Meme coin madness meets technical momentum as Dogwifhat defies gravity.
The Breakout Signal
WIF's chart pattern screams bullish continuation—traders are betting this isn't just another pump-and-dump spectacle. That $1.34 target isn't pulled from thin air; it's the next logical resistance level based on current momentum.
Market Mechanics at Play
Volume spikes confirm institutional interest alongside retail FOMO. Liquidity pools are swelling while shorts get squeezed into oblivion. The token's Solana foundation gives it technical cred beyond typical meme coins.
Reality Check
Let's be real—this could either print generational wealth or become another 'I told you so' story in crypto's casino economy. Because nothing says sound investing like betting on a dog wearing a hat.

Recent price action and technical indicators suggest that the memecoin is positioning itself for a potential rally towards the $1.34 resistance level, offering promising upside for traders who closely monitor key levels.
Ascending Triangle Signals Potential for Strong Uptrend
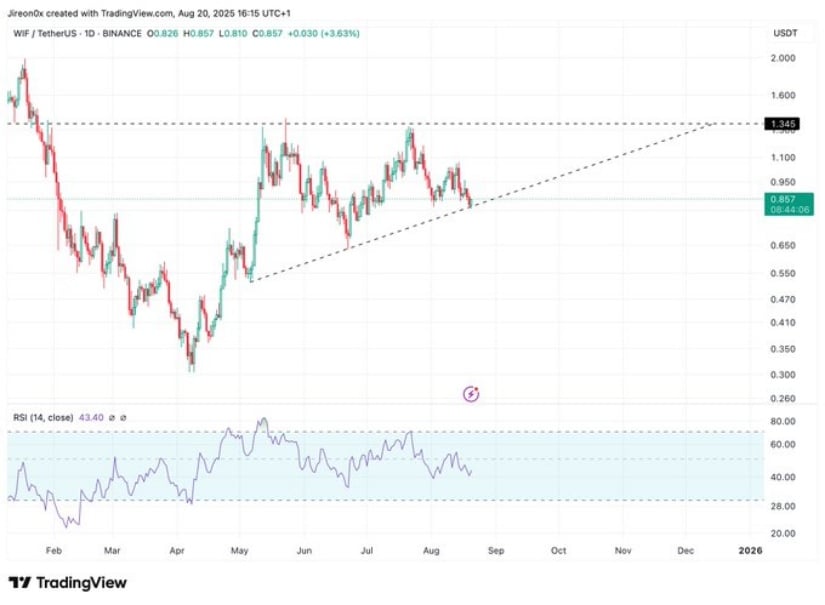
The price of $WIF has been consolidating within an ascending triangle, marked by higher lows approaching a resistance barrier NEAR $1.00. The repeated testing of the $0.85 support shows solid buying interest at this level, providing a firm base for a breakout. If the price can surpass the $1.00 resistance zone, traders may see a sustained push higher, with $1.34 as the next significant target.
Source: X
The Relative Strength Index (RSI) currently reads at 43, indicating neutral market conditions without any immediate overbought or oversold extremes. This neutrality allows room for momentum to gather as the oken approaches the breakout zone. A price surge above resistance could push RSI into overbought territory, further confirming the bullish setup and attracting additional buyers.
Key Support and Resistance Levels Define Next Moves
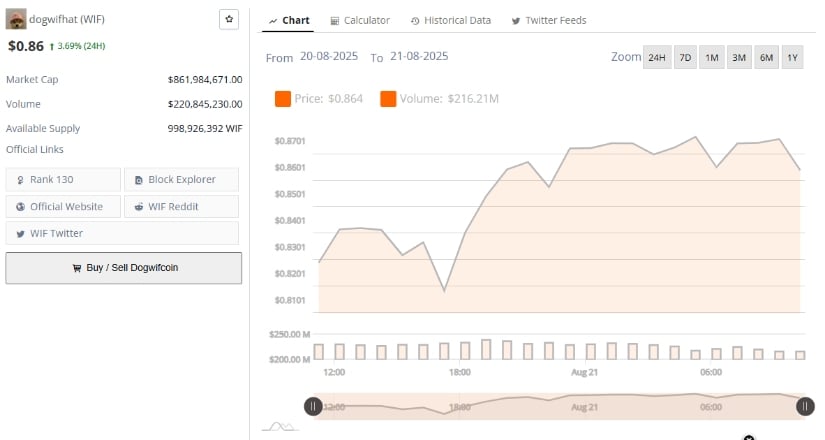
Trading volume has remained relatively stable but lower compared to previous high-volatility periods, signaling that market participants are awaiting confirmation before committing heavily. This volume pattern supports the idea that traders are patiently watching the ascending triangle’s resolution.
Source: BraveNewCoin
The support level near $0.85 has been tested multiple times and has consistently held, demonstrating its importance as a buying zone. Should this support fail to hold, the coin could test lower support levels around $0.75 and $0.65, which WOULD be crucial for identifying any potential trend reversals.
Resistance at $1.00 has been a challenging ceiling for the token recently. A successful breakout above this threshold would likely pave the way for a MOVE to $1.34, a major resistance from past price cycles. Traders will closely watch this level, as breaking it would signal a stronger belief in a sustained upward trend.
Technical Indicators Show Market Consolidation
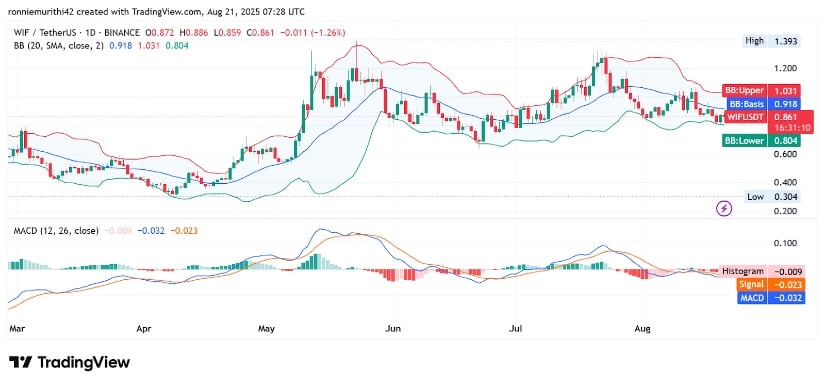
The Bollinger Bands indicate a period of low volatility with the price trading tightly within the bands, suggesting consolidation. This pattern often precedes a breakout, with expansion of the bands signaling the start of a new trend.
A move above the upper band could mark a volatility surge and a sharp price increase, while a break below the lower band might suggest further downside or extended sideways trading.
Source: TradingView
The MACD currently sits with the MACD line just below the signal line, reflecting neutral momentum and no clear directional bias. A crossover to the upside would confirm rising bullish momentum, offering an early signal of a breakout. Conversely, continued bearish divergence could indicate increasing selling pressure.
Key levels to watch include the $0.85 support and the $1.00 resistance, with a breakout above $1.00 potentially propelling $WIF towards the $1.34 target. Traders should remain vigilant for volume surges and indicator confirmations to capitalize on this promising setup while managing risk during this consolidation phase.
