XLM Price Surge: $0.44 Breakout Target in Sight as Bullish Momentum Accelerates

Stellar's XLM charges toward critical resistance levels as bullish indicators flash green across trading platforms.
Technical Breakout Pattern
XLM consolidates below the $0.44 threshold—a level that's become the crypto's line in the sand. Trading volume spikes while whales accumulate positions, signaling potential upward momentum. The pattern mirrors previous breakout scenarios that saw 30-50% runs within weeks.
Market Sentiment Shift
Traders ditch conservative plays for risk-on altcoin strategies. XLM's low transaction costs and banking partnerships make it a favorite for institutions dipping toes into crypto waters—because nothing says 'financial revolution' like legacy banks using blockchain for settlements.
Targets and Trajectory
A clean break above $0.44 opens path to $0.60 resistance. Support holds firm at $0.35, creating favorable risk-reward ratio for swing traders. Relative strength index avoids overbought territory despite recent gains.
Watch trading volume confirms breakout authenticity—not just another fakeout in crypto's theater of price prediction. Sometimes the charts actually reflect reality instead of hopium.

Recent price action and momentum indicators collectively suggest that the coin is transitioning into a bullish phase, offering promising entry opportunities for traders anticipating upward movement.
Short-Term Bullish Momentum Indicates Breakout Potential
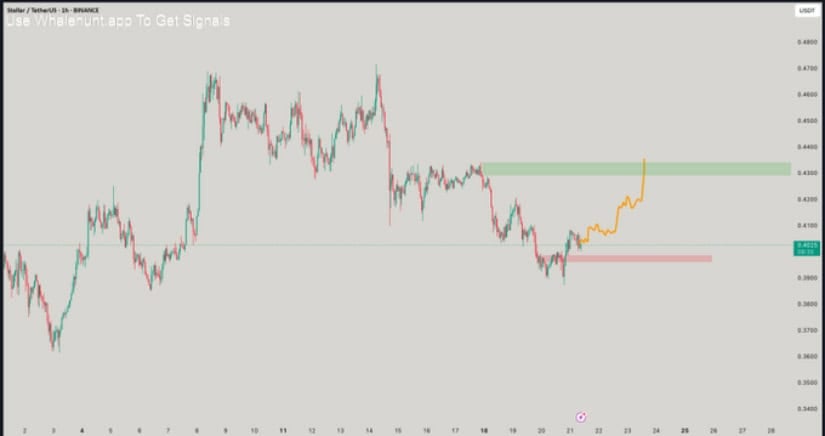
A chart shared by Andrew Griffiths highlights a breakout scenario for XLM, with the price targeting resistance around $0.44. An orange trendline marks sustained bullish movement, positioning the current $0.40 price area as an attractive level for buyers seeking momentum.
Historical data shows the asset repeatedly bouncing off solid support NEAR $0.38, which reinforces the foundation for continued upward price action.
Source: X
As long as prices hold above $0.38, the market structure favors a push toward $0.44, a critical resistance zone. Surpassing this level could open the door for even higher targets in the following weeks, especially given the broader positive sentiment permeating the cryptocurrency market.
Market Overview Shows Robust Participation and Uptrend Stability
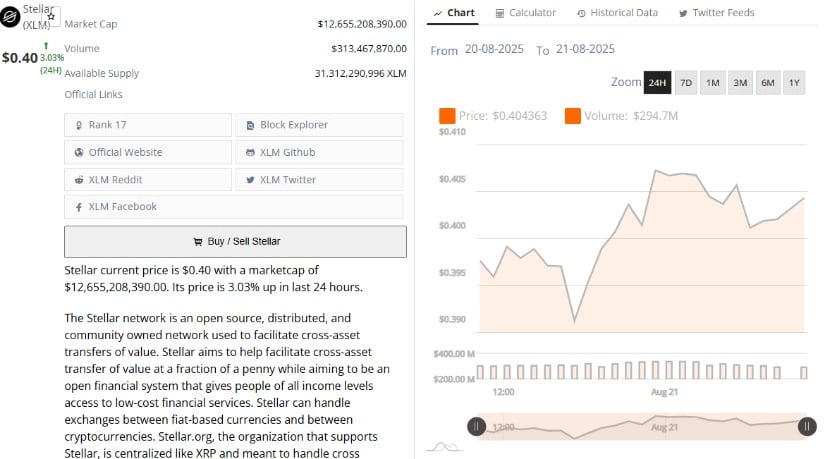
Additionally, BraveNewCoin data provides a 24-hour market chart, confirming a 3.03% price gain to $0.40 and reinforced by vibrant trading activity. With volume climbing to $313.5 million, strong market participation supports the idea that XLM is well-positioned to challenge and potentially break resistance between $0.42 and $0.44.
Source: BraveNewCoin
Recent trading reflects consolidation near these levels, signaling that a breakout could trigger more pronounced upward momentum. However, traders should remain aware of broader market influences, such as Bitcoin and Ethereum, given their tendency to affect altcoin price dynamics.
Technical Indicators Signal Approaching Inflection Point
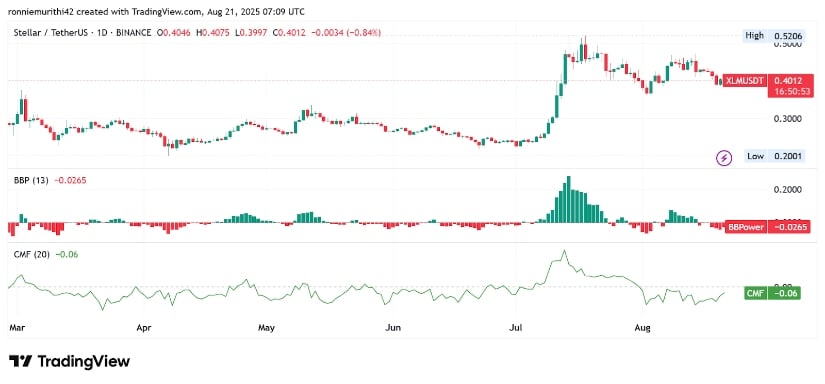
On the other hand, TradingView offers deeper technical insight through key indicators like Bollinger Bands Percent (BBPower) and Chaikin Money FLOW (CMF). A slightly contracting BBPower reading at -0.0265 suggests lower volatility, typical during consolidation phases that often precede strong price moves.
Source: TradingView
Although the CMF sits at -0.06, indicating mild bearish sentiment, this doesn’t pose a significant threat to the emerging uptrend. Vigilance is advised, though, as a breakout above $0.40 accompanied by rising volume and favorable shifts in these indicators could ignite a strong bullish surge pushing prices toward $0.44 and beyond.
n conclusion, the token appears set for an upward trend, with important support near $0.38 and a near-term price target around $0.44 to $0.45. While resistance levels may attract selling pressure, the current market structure and momentum indicators paint an optimistic picture for traders looking to capitalize on potential gains as bullish momentum strengthens.
