Hedera Price Plummets Despite Liquidity and Search Surge

Hedera's price takes a nosedive while liquidity and search metrics scream bullish—classic crypto divergence at play.
Market Mechanics vs. Momentum
Liquidity floods the ecosystem, search volumes spike to unprecedented levels, yet the price chart paints a brutal red candle. The algorithm-driven sell pressure overwhelms retail enthusiasm, creating the perfect storm of technical versus fundamental disconnect.
Search Surge Meets Selling Pressure
Retail interest hits record highs as newcomers flock to Hedera, drawn by the liquidity pump. Meanwhile, whales and algorithms execute coordinated dumps—because why let fundamentals get in the way of a good old-fashioned profit take?
Finance's favorite paradox: when everyone's looking, someone's always leaving with the bags.

Analyst Bull Bear Spot sees a bullish correlation between its price and M2 Liquidity, indicating a potential surge. Additionally, a 90-day high in Google Search volume for the asset indicates growing retail interest, potentially fueling further market activity.
However, despite the bullish outlook, the asset saw a 2.34% drop from August 18 to August 19, 2025, suggesting some selling pressure. Increased trading volume during this period, peaking at $321 million, reflects heightened market activity. As the price hovers NEAR key support levels, traders are keenly watching for signs of a potential rebound or continued bearish momentum.
HBAR Price Pullback Amid Liquidity Trends
Hedera Hashgraph has experienced a notable price decline, despite strong liquidity conditions suggesting potential bullish momentum. On August 18 to August 19, 2025, the price dropped by 2.34%, beginning the trading period at around $0.246 and reaching a peak of $0.238.
This sharp decrease points to a bearish trend, driven in part by increased selling pressure in the market.
The market’s liquidity dynamics, as highlighted by analyst Bull Bear Spot, demonstrate a strong correlation between its price movements and M2 Global Liquidity. The recent price surge aligned with a similar increase in liquidity, reinforcing the expectation of a breakout.
However, the pullback challenges the optimistic outlook, indicating that shifted market sentiment and selling pressure may outweigh upward potential.
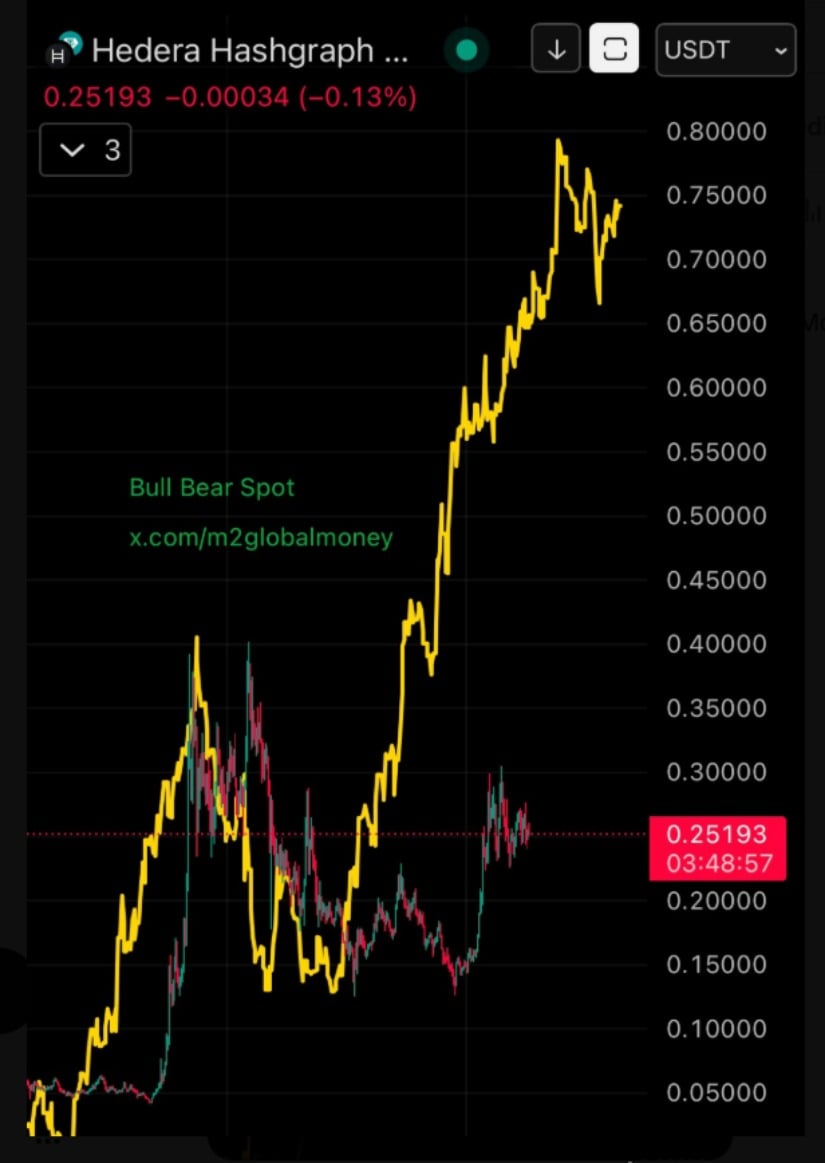
HBARUSD Chart | Source:x
Retail Interest Spikes as Search Volume Hits New Highs
Hedera has seen a surge in search volume, marking a 90-day high according to Google Trends data. This spike in search interest has raised speculation about the return of retail investors, a group often associated with driving market rallies. Analyst STEPH IS crypto noted the increase as a possible indicator of renewed market interest, especially after a period of stability.
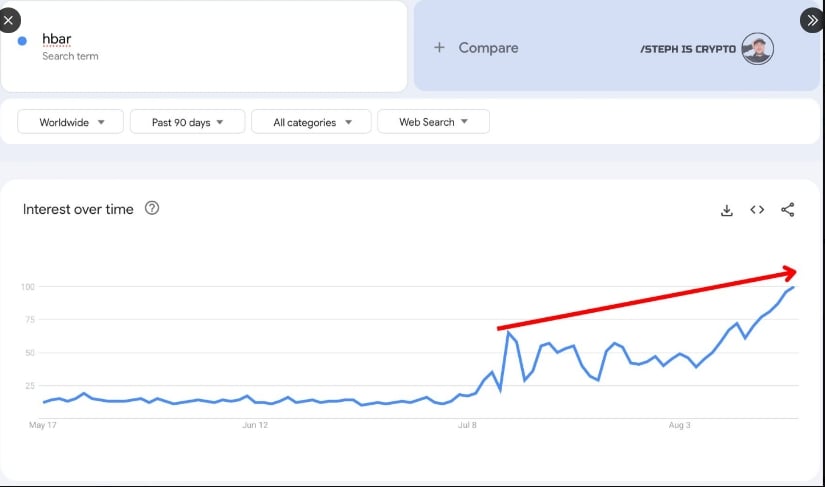
HBARUSD 90-Day Chart | Source:x
Retail interest has been known to contribute to significant price moves in the past. The uptick in search volume might suggest that retail investors are reacting to growing sentiment or new developments within its ecosystem.
Hence, the rise in retail participation could drive further price action, depending on whether search volume continues to increase or stabilizes.
Technical Analysis Shows Resistance at Key Levels
The technical analysis points to crucial support and resistance levels in the wake of the recent price action. After peaking at $0.258, its price experienced downward movement, bringing it closer to the $0.242 support zone. The chart reflects a sharp decline from the earlier price points, signaling that the market may be testing the strength of these support levels.
Investors are now watching closely for any signs of stabilization around the $0.240 range. If the price holds at this level, it may indicate a potential rebound. Conversely, a sustained drop below $0.240 could signal a further downward trend, especially if selling pressure remains strong.
Trading Volume Reflects Increased Market Activity
Trading volume has also seen notable fluctuations during the 24-hour period, with a peak of approximately $321 million. The surge in volume coincided with the price decline, indicating that large-scale selling may have contributed to the drop in price. The increased participation in the market reflects heightened investor activity, which could point to further volatility in the near term.
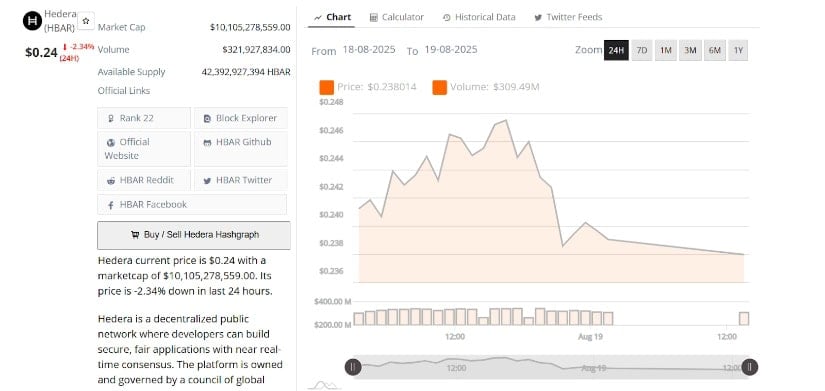
HBARUSD 24-Hr Chart | Source: BraveNewCoin
As the market moves into the next trading sessions, the liquidity injections and volume levels will play a key role in determining the next direction. A sustained rise in trading volume could indicate a shift in market sentiment, potentially fueling either a recovery or further price decline. Market participants will need to closely monitor both the price action and volume trends to assess the likelihood of a significant MOVE in either direction.
