Hedera Defies Market Pressure: Bullish Breakout Imminent in Crypto’s Next Big Move

Hedera (HBAR) isn't backing down—traders are circling like sharks as the token flirts with a potential bullish surge. Forget 'wait and see'; this is a high-stakes standoff between fear and greed.
Why the hype? The hashgraph darling keeps defying broader market sluggishness, teasing a breakout that could send it soaring past resistance levels. No guarantees, of course—this is crypto, where even 'sure things' vanish faster than a hedge fund's ethics.
Technical signals hint at momentum building, but let's be real: in a market where Elon's tweets move needles more than fundamentals, anything goes. One thing's certain? Volatility is the only free lunch here.

The $0.23 support remains critical for sustaining this setup.
Analyst Fresh views the current price as a “huge discount,” projecting a rise toward $0.40 within two months, signaling over 70% upside potential. Short-term resistance lies in the $0.265–$0.27 range, with a break above increasing chances of testing $0.30. However, failure to hold the $0.25 level could lead to a retest of lower demand zones NEAR $0.24, delaying any bullish reversal.
Ascending Triangle Formation Suggests Potential Upside
According to analyst Jireon on X, Hedera Hashgraph is currently forming an ascending triangle pattern on the four-hour chart. This structure is often associated with bullish continuation and may indicate that the price could target the $0.30 level if confirmed. The analyst notes that a bullish engulfing pattern in the next four-hour candle would signal strong buying pressure, increasing the chances of an upward breakout.
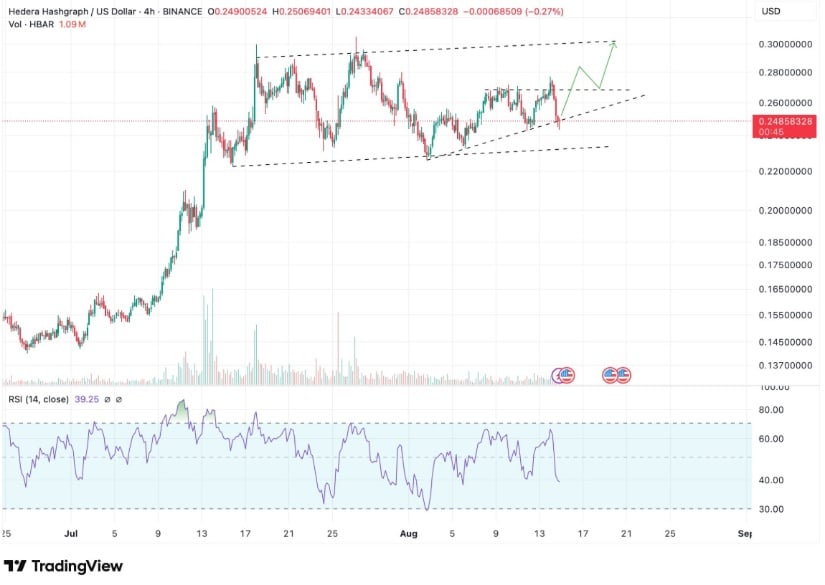
HBARUSDT 4-hr Chart |Source:x
Jireon also identified $0.23 as a critical support level. If this threshold fails to hold, the bullish setup could be invalidated, potentially sending it toward lower price levels. Current RSI readings are near oversold territory, which may support a rebound scenario. However, price movement in the coming sessions will be key in determining whether momentum shifts toward a breakout or a retest of lower support zones.
Current Price Action and Technical Levels
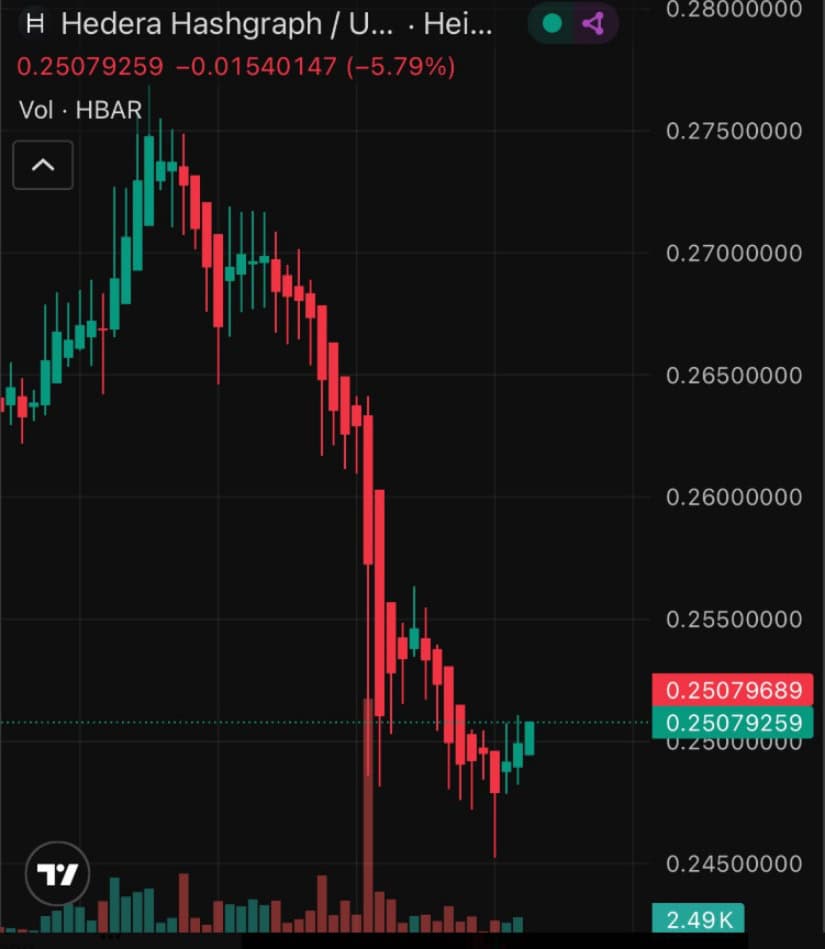
The token recently saw a sharp decline from approximately $0.28 to the current $0.25 region, a drop of about 5.8% in the latest session. This MOVE was marked by consecutive red candles and strong selling volume, reflecting sustained bearish pressure over the past several days. Despite this, a recent cluster of green candles near the $0.245 level signals an early attempt at recovery.
If buying momentum holds, traders may look toward the $0.265–$0.27 range as the first resistance zone. A break above this area could pave the way for a retest of the $0.30 mark. Conversely, failure to maintain support near current levels could prompt a move back to the $0.24 region, delaying potential upward continuation.
Analyst Fresh Projects Longer-Term Target
Another market view comes from analyst Fresh, who describes its current valuation as a “huge discount.” Fresh has set a two-month target of $0.40, which WOULD represent more than a 70% increase from current prices. The projection suggests that the recent sell-off could present accumulation opportunities for those anticipating a reversal.
Source:x
For this scenario to develop, the asset would need to hold its current support and build buying momentum. Short-term moves toward $0.27 would improve the probability of retesting $0.30 before advancing toward Fresh’s longer-term target. The focus remains on whether market conditions will support sustained upward price action in the near term.
Market Performance and Trading Activity
At the time of reporting, HBAR is trading at $0.25, reflecting a 7.20% drop in the past 24 hours. The trading session began with a steep decline from above $0.27 to $0.25, followed by a period of sideways movement. This pattern points to strong early selling pressure, which eased later in the day as the price stabilized near support.
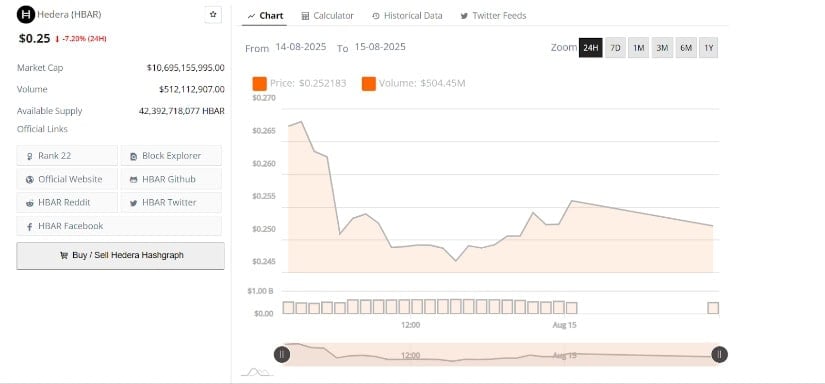
HBARUSDT 24-Hr Chart | Source: BraveNewCoin
Market capitalization currently stands at $10.69 billion, with $512 million in daily trading volume. The steady participation suggests continued interest in the token despite recent bearish movement.
Intraday trading saw minor recovery attempts, though sellers maintained control and limited the rebound. A confirmed bounce from current levels could attract more buyers targeting a move back toward $0.27, while a break below $0.25 may lead to testing lower demand zones.
