Optimism Defies the Bears: Bullish Patterns Emerge Despite Relentless Selling Pressure

Optimism (OP) is staging a rebellion against market pessimism—forming textbook bullish reversal patterns while shorts pile on. Here's why the crowd might be wrong.
The setup: Contrarian fuel
On-chain data shows record short positions against OP, yet price action paints a different story. Ascending triangles and hidden bullish divergences suggest trapped bears.
The catalyst: Liquidity hunt
Market makers love nothing more than liquidating overleveraged traders. With OP's perpetual funding rates deeply negative, the stage is set for a violent squeeze.
The punchline: Wall Street's déjà vu
Just like traditional finance loves 'buy the rumor, sell the news,' crypto thrives on 'sell the fear, buy the panic.' OP's chart whispers what the fear-mongering headlines won't—sometimes the best trades smell like risk. (And yes, hedge funds will still claim they saw it coming.)

A rebound NEAR the 9-day EMA or mid-channel zone could drive a retest of $0.85–$0.90, with a breakout potentially targeting $1.00.
In contrast, analyst Crypto NL identifies a descending wedge pattern, a bullish reversal structure similar to setups in Cardano (ADA) and Injective (INJ). A confirmed breakout above the red trendline could open the path toward $1.20, $3.00, and even $4.87. However, it has fallen over 10% in 24 hours to $0.75, facing heavy selling pressure and key support at $0.74.
Optimism Trades Within Ascending Channel Structure
According to analyst Alpha Crypto Signal on X, Optimism continues to trade inside a well-defined ascending channel. The price is respecting both the upper resistance and lower support boundaries of the formation. Current price movement shows a pullback from the channel’s upper range, a development viewed as normal after recent upward moves.
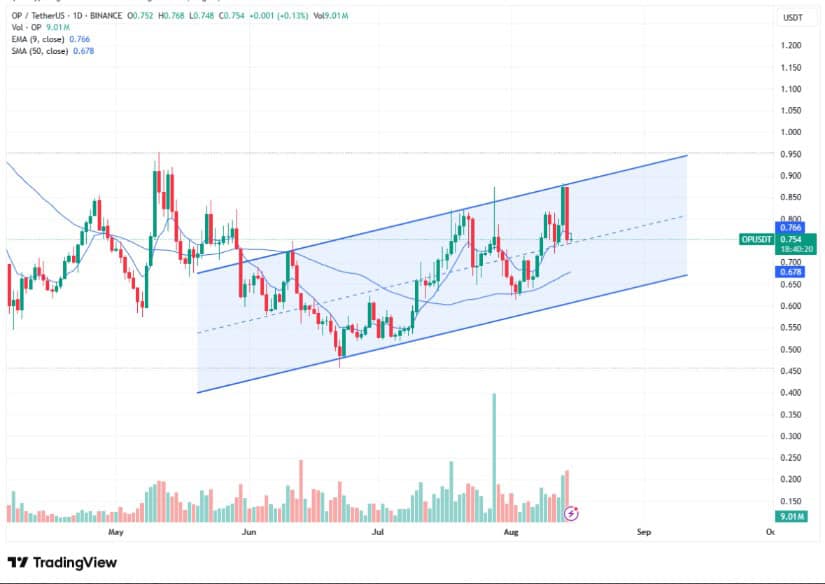
OPUSDT 1-Day Chart | Source:x
The analyst notes that this retracement will not disrupt the broader bullish setup if it remains above the channel’s midpoint and lower support line. A rebound from the 9-day exponential moving average (EMA) or mid-channel zone could initiate another upward MOVE toward the $0.85–$0.90 area. A breakout above the channel’s upper boundary, accompanied by strong trading volume, could open the way for a move toward the $1.00 level in the coming weeks.
Descending Wedge Pattern Signals Potential Reversal
Analyst Crypto NL reports that the asset is trading inside a descending wedge pattern. This setup resembles earlier formations seen in Cardano (ADA) and Injective (INJ), which preceded upward rallies. The price is testing the wedge’s upper descending trendline marked in red, while consolidating near the lower end of the structure.
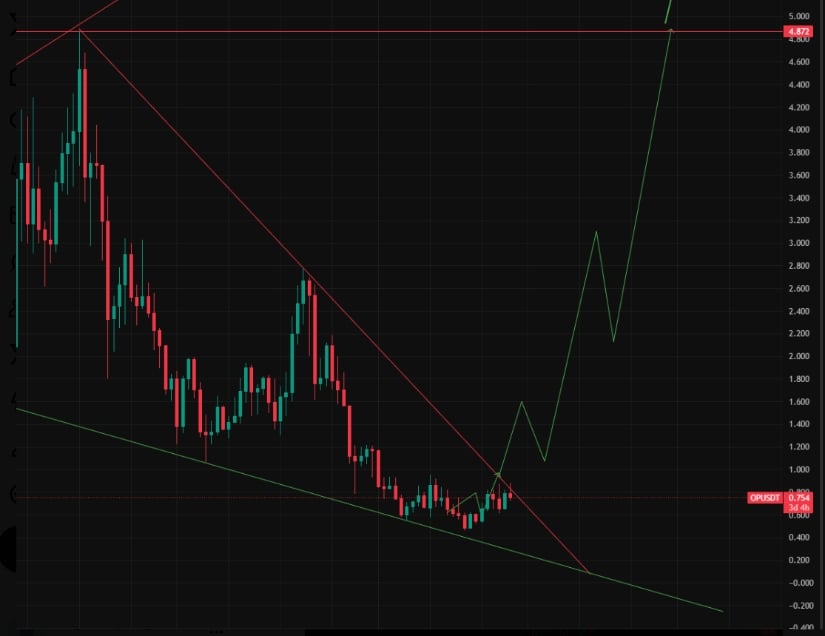
Source:x
The descending wedge is often associated with potential bullish reversals. According to the analysis, a confirmed breakout above the red resistance trendline could see it move toward $1.20 in the short term. The projected move could extend into a multi-stage rally, targeting $3.00 and later $4.87, if supported by sustained buying activity and confirmation after the breakout.
Comparison to Previous Market Setups
Crypto NL adds that its current chart position mirrors earlier breakouts in ADA and INJ. In both cases, a break above the descending resistance led to extended upward trends. The green path plotted on the chart outlines a possible bullish rally scenario if the breakout gains traction.
Additionally, the success of this pattern depends on market conditions aligning with increased trading volume. Failure to break above the resistance may keep the cryptocurrency within its consolidation range.
Short-Term Price Decline and Market Metrics
On the 24-hour chart, the asset recorded a sharp decline from around $0.82 to $0.75, representing a drop of over 10%. The steepest losses occurred in the early trading hours, with the price sliding below $0.76 before stabilizing briefly. Despite minor intraday recoveries, the price trend remained negative for the day.
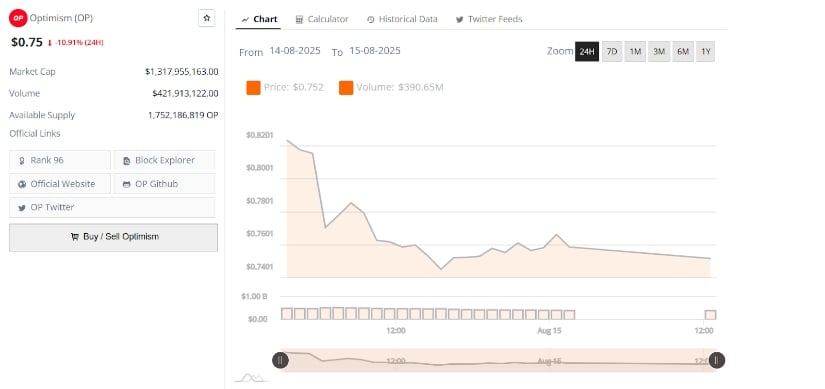
OPUSDT 24-Hr Chart | Source:x
Trading volume during the same period stood at approximately $390.65 million, reflecting strong selling pressure. The market capitalization is now at $1.31 billion, with 1.75 billion tokens in circulation.
Analysts indicate that the $0.74 zone could act as a key support level if downward momentum persists. A break below this threshold could accelerate losses, while a recovery above $0.78 might provide short-term relief for buyers.
