Stellar (XLM) Shatters Falling Wedge—Next Stop: Breaking Key Resistance

Stellar’s XLM just ripped through a falling wedge pattern—bulls are now eyeing a decisive breakout above critical resistance. Here’s what’s at stake.
Technical breakout or fakeout?
The crypto market’s favorite drama—price patterns—just delivered another episode. XLM’s wedge breakout could signal a trend reversal… or another ‘buy the rumor, sell the news’ trap for overeager traders.
Resistance levels loom large
If XLM clears this hurdle, the next targets are obvious. Fail? Well, there’s always the ‘macroeconomic conditions’ excuse ready for deployment.
Finance never changes—only the assets do. Stellar’s latest move? Just another reminder that charts are either crystal balls or Rorschach tests, depending on who’s holding the bag.
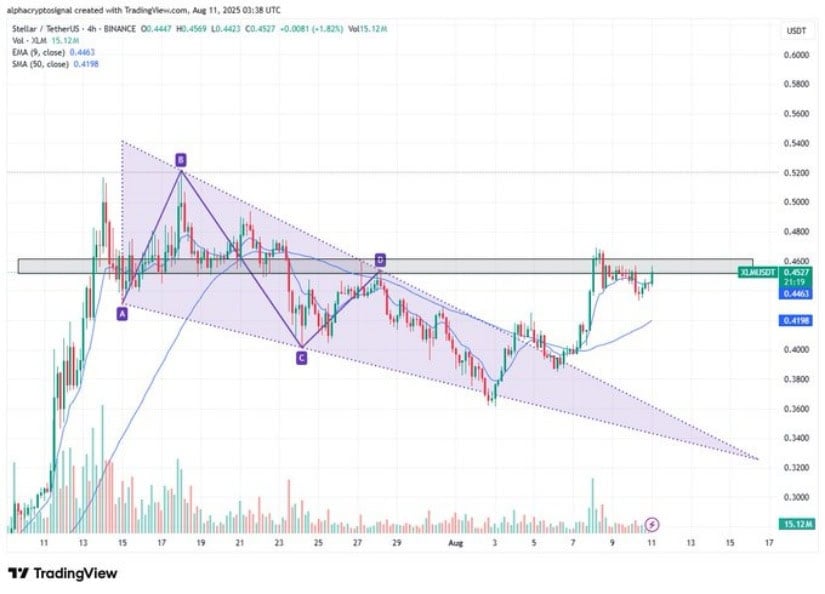
In a recent X post, crypto commentator Alpha Crypto Signal highlighted this key development, noting that the asset’s price has rallied impressively from lows and now faces a critical horizontal resistance zone.
Currently trading NEAR $0.4527, XLM is testing the resistance range between $0.455 and $0.460, a crucial level for confirming the strength of its breakout.
Stellar Price Faces Resistance
The 4-hour chart for XLM/TetherUS confirms the breakout from the falling wedge pattern that had contained price declines, signaling that the prolonged downward trend may be ending.
This breakout places the cryptocurrency in a position to challenge a horizontal resistance zone that has acted as both support and resistance previously. The analyst stresses that a clean breakout above $0.460, followed by sustained holding, is essential for continuing upward momentum.
Source: X
If this resistance hold fails, the post identifies two important support zones that could maintain the bullish structure. The first support is the dynamic 9-period Exponential Moving Average (EMA 9) around $0.446, which offers short-term buying interest.
The second significant support level is the 50-period Simple Moving Average (SMA 50) at roughly $0.420, which WOULD be critical to prevent a deeper decline and preserve the integrity of the breakout.
Market Volatility and Trading Volume Trends
Additionally, BraveNewCoin’s 24-hour price and volume for this cryptocurrency show notable volatility, with the price fluctuating between approximately $0.315 and $0.455 during recent sessions.
Despite a late-night rally to around $0.455, the asset corrected downward to $0.44, marking a 0.61% decline over the period. This price action reflects an actively traded market with rapid sentiment changes.
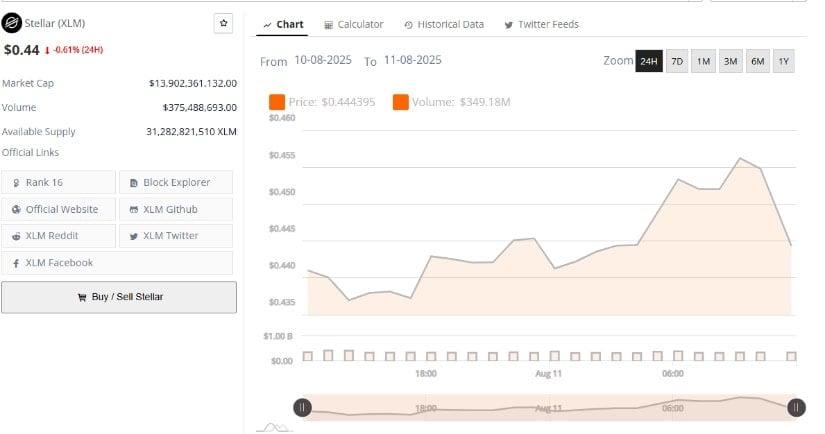
Source: BraveNewCoin
Trading volume remains substantial at about $375 million in 24 hours. A large volume spike coincided with the initial price surge, indicating strong buying pressure helped drive the rally. The latter pullback was also met with considerable volume, suggesting traders engaged in profit-taking.
Such volume dynamics, paired with price swings, demonstrate DEEP market participation and caution among buyers and sellers alike. With a market capitalization exceeding $13 billion, the asset is firmly ranked among the top cryptocurrencies, confirming strong investor interest and liquidity.
Technical Indicators and Momentum Signals from TradingView
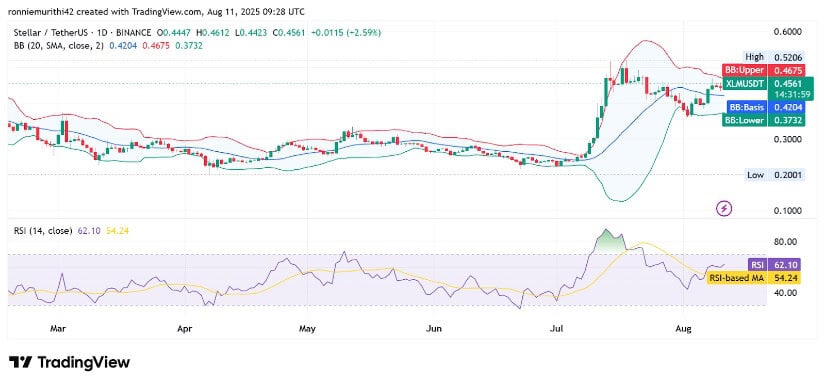
At the time of writing, according to TradingView data, the cryptocurrency is trading near $0.4573 at the time of writing, showing a 2.86% gain for the day. The daily chart illustrates a trend that has been gradually strengthening since late June. The price rallied sharply in late July, reaching the upper Bollinger Band before undergoing a price correction.
Source: TradingView
After this pullback, the asset regained momentum, moving above the mid-Bollinger Band, a key indicator of renewed bullish strength. The RSI stands at 62.33, positioned solidly above the neutral 50 level and its moving average of approximately 54.26. This RSI movement indicates growing buying interest despite a recent short-term correction.
Traders will look for the price to maintain support above the mid-Bollinger Band to confirm the continuation of the recovery. If sustained, the crypto could test previous highs near the upper Bollinger Band. Failure to hold might trigger a MOVE back toward the established support areas.
