🚀 BNB Breaks Out: Binance Coin Targets $1,000 as Bulls Take Control

Binance Coin (BNB) just shattered resistance levels—and crypto traders are laser-focused on that four-digit price target. Here's why the charts scream upside.
The breakout play: Technicals suggest BNB's consolidation phase is over. The token's recent surge past key moving averages signals institutional accumulation—or at least speculative FOMO.
Market mechanics at work: With the $1,000 psychological barrier in sight, liquidity pools above current levels could trigger a parabolic move. Just don't mention how often crypto 'sure things' reverse right after headlines hit.
Greed check: While the pattern resembles BNB's 2021 bull run, remember: exchanges' native tokens tend to moon until regulators start asking uncomfortable questions. Trade accordingly.

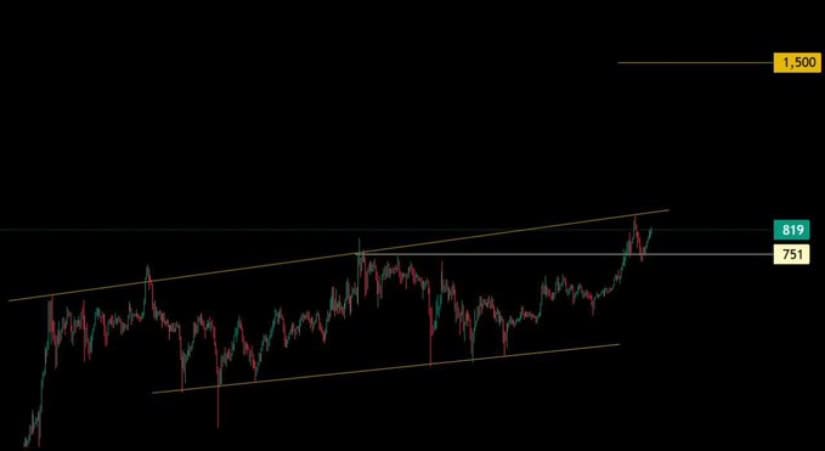
Recently, crypto commentator MANDO CT (@XMaximist) posted on X, stating, “$BNB is moving beautifully. 1K is the nearest target.” The current price of around $819 confirms a decisive move beyond previous consolidation, hinting at a potentially powerful continuation toward $1,000.
BNB Technical Breakout Signals Bullish Momentum
The long-term technical analysis accompanying the X post highlights that BNB has been trading within an upward-sloping price channel for an extended period. Most recently, the asset cleared a significant horizontal resistance at $751, marking a pivotal moment as it transitions out of a consolidation phase.
The breakout to $819 places Binance Coin on track to test the upper boundary of this channel, reinforcing the bullish outlook.
Source: X
This breakout invalidates the prior range-bound behavior and suggests that a fresh leg of the uptrend has commenced. The chart also shows a projected long-term target NEAR $1,500, indicating substantial further upside if momentum continues. The current price movement aligns with the analyst’s projection of sustained growth, situating $1,000 as the immediate next goal for the coin.
Price Movement and Volume Patterns from Brave New Coin
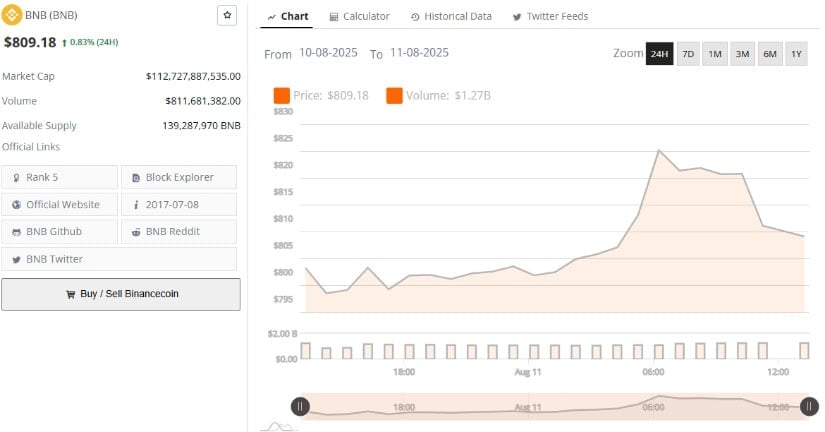
According to Brave New Coin’s last 24-hour data, Binance Coin traded at approximately $809.18, reflecting a 0.83% gain. Price action included an early morning rally from about $795 to over $820, followed by a correction pulling back to current levels around $810. This volatility reflects active trading and quick shifts in market sentiment.
Source: BraveNewCoin
Trading volume was substantial at over $811 million, with notable spikes during both the rally and the subsequent correction. The increased volume during the price surge indicates strong buying interest, while the high volume accompanying the pullback suggests profit-taking.
This volume-price relationship shows vigorous market participation and highlights an ongoing balance between bullish momentum and cautious profit booking.
With a market capitalization exceeding $112 billion and ranking fifth among cryptocurrencies, Binance Coin maintains a strong market presence backed by significant liquidity and investor engagement.
Technical Breakdown of Binance Coin’s Price Action and Momentum
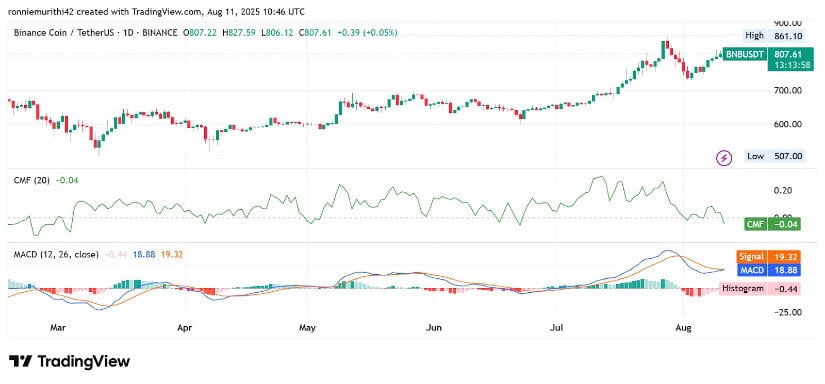
At the time of writing, TradingView reports Binance Coin trading near $810.50, up by about 0.41% for the day.
The daily chart shows the coin in a firm uptrend since late June, reaching new highs in the current period. A minor pullback occurred in early August, but the price quickly recovered and remains near the upper end of the recent trading range, signaling sustained bullish strength.
Source: TradingView
The Chaikin Money FLOW (CMF) indicator is positive at +0.04, denoting net inflows and dominant buying pressure. In contrast, the Moving Average Convergence Divergence (MACD) shows a recent bearish crossover, with the MACD line below the signal line and red histogram bars appearing.
However, the histogram bars are small, suggesting this bearish signal may reflect a short-term cooling off rather than a reversal. This technical combination points toward continued bullish momentum with a minor pause in upward momentum.
Traders will likely watch for the price to hold above current support levels and sustain the positive CMF reading to confirm the ongoing uptrend. Failure to maintain support could lead to increased volatility, but overall, the technical picture remains favorable.
