Chainlink Primed for Bullish Reversal—Traders Eye $16.10 as Key Support Level

Chainlink’s price action hints at a potential turnaround—just as short-sellers start circling the $16.10 support like vultures.
Here’s the playbook:
The Setup: After weeks of sideways movement, LINK’s chart flashes early reversal signals. Technical traders are watching for a bounce off $16.10—a level that’s now the battleground between bulls and bears.
Why It Matters: A clean hold above support could trigger a cascade of short-covering. But if it breaks? Cue the usual crypto melodrama of ‘macro headwinds’ and ‘liquidity crunches’—because fundamentals always take the blame when leverage gets wrecked.
Watch This: Volume trends on the rebound attempt. No fireworks there, and this becomes just another dead-cat bounce in the crypto graveyard.

At the time of writing, LINK trades at $16.39, showing signs of compression NEAR a critical support level. Price action across multiple timeframes reflects a market caught between fading bullish momentum and short-side opportunity.
Short Strategy Highlights Bearish Sentiment Below $16.50
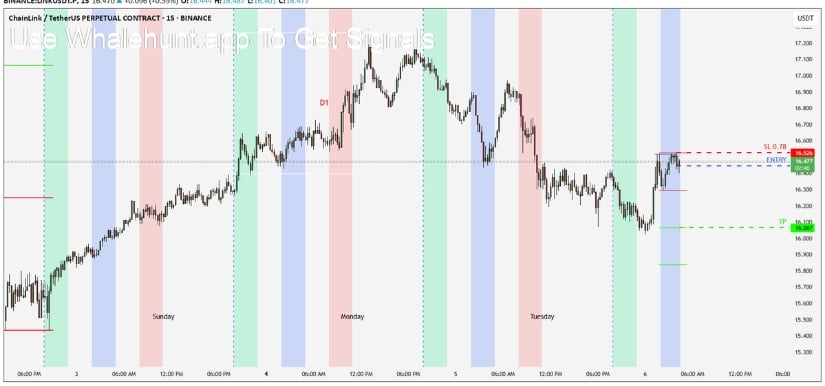
A 15-minute chart shared by analyst Andrew Griffiths highlights a precise short entry strategy tailored to Chainlink’s intraday movements.
The plan employs a “set and forget” model, with a short position marked at $16.477, just below the key $16.50 level. The strategy includes a narrowly defined stop loss at $16.526, with a target set at $16.10. This offers a favorable risk-to-reward ratio of nearly 1:5, aiming to capture downside momentum with minimal interference post-execution.
Source: X
Technically, the setup is underpinned by a rejection of previous highs near $16.80, followed by a series of lower highs and reduced volume. The consolidation range reflects fading buying pressure, while the red zone marked on the chart signifies a bearish bias.
Griffiths’ trade aligns with this zone’s upper boundary, further validating the idea of local resistance. Notably, the $16.10 region was previously identified as a demand zone, increasing the probability of price revisiting that level should selling pressure resume.
BraveNewCoin Data Shows LINK in Short-Term Decline
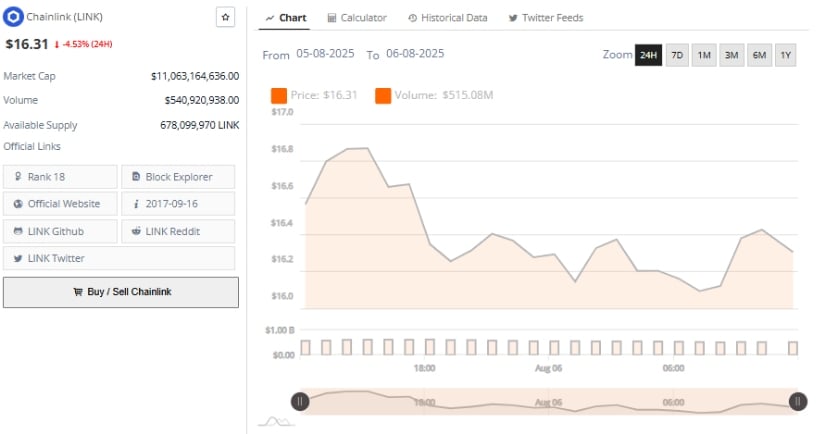
Additionally, BraveNewCoin’s 24-hour chart reinforces the short thesis with a clear downward trend. LINK has declined by 4.53% over the past day, currently trading near $16.31. The session began with a brief rally to $16.75, followed by a steady decline punctuated by lower highs and lows, a textbook indicator of bearish short-term sentiment.
While buyers made attempts to reclaim the $16.50 zone, resistance held firm, leaving the price to consolidate below this threshold.
Source: BraveNewCoin
Volume dynamics further underscore the current market caution. Turnover peaked around $515.08 million early in the session but declined sharply as the price dropped. This divergence signals that selling momentum may be easing, although no significant accumulation has emerged to support a reversal.
A local support level appears to have formed near $16.10, where the token has previously seen stabilization. Whether this level continues to hold will likely influence the next directional move.
Daily Chart Reflects Consolidation Amid Waning Momentum
At the time of writing, the daily chart on TradingView positions LINK at $16.39, with price action consolidating after a decline from a recent high of $20.28.
The structure remains broadly bullish over the medium term, supported by a series of higher lows since mid-June. Immediate resistance is identified near $19.53, while firm historical support sits at $10.10, offering context for both upward and downward scenarios.

Source: TradingView
Momentum indicators present a mixed outlook. The Percentage Price Oscillator (PPO) histogram is currently negative, with the PPO line below its signal line, suggesting declining bullish strength. Meanwhile, the Relative Strength Index (RSI) is at 47.31, below its moving average but above oversold territory.
A hold above RSI 45 is critical to maintain current levels, while a rise back above 50 could signal renewed buying interest. Until then, the price remains within a tightening range as traders monitor for signs of a breakout or breakdown.
