Binance Coin (BNB) at a Crossroads: Will $700 Hold or Fold Before the Next Rally?

BNB teeters on the edge—market watchers brace for a potential plunge below $700 before bulls regain control.
The Dip Before the Rip
Binance Coin's chart paints a classic 'buy the rumor, sell the news' scenario. After months of sideways action, traders are eyeing $700 as the line in the sand. Break it, and we're looking at liquidation cascades. Hold it, and the path to new ATHs opens up.
Exchange Token Paradox
While BNB's utility burns brighter than ever (thanks, Binance Smart Chain), its fate remains chained to the mothership's regulatory rollercoaster—because nothing says 'decentralization' like sweating SEC subpoenas.
The Bottom Line
Smart money's already accumulating. Dumb money? Still arguing about whether CZ wears socks with sandals. Place your bets.

As the market shows mixed signals, analysts suggest the possibility of further downside pressure before a potential reversal. Investors are now closely observing whether the price will dip below the critical $700 support level, which could set the stage for a strong rebound.
Binance Coin Price Key Levels to Watch
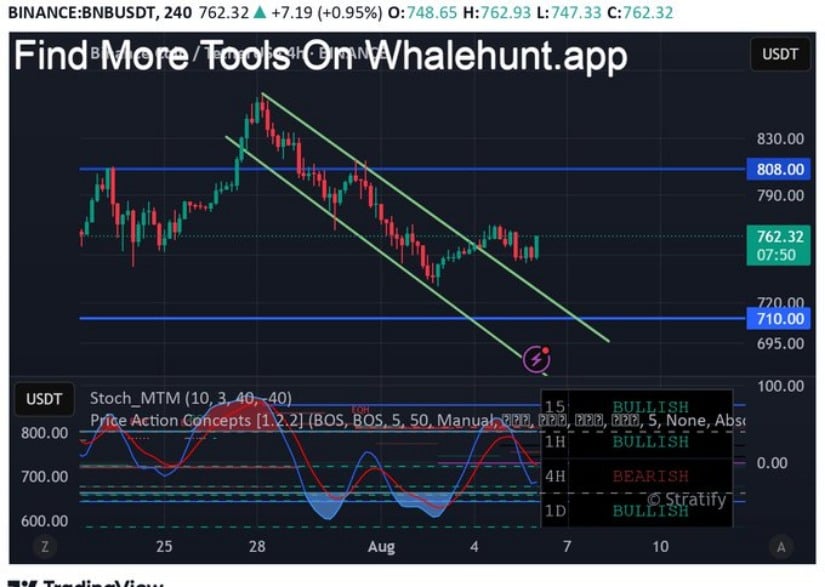
The recent chart analysis highlights the formation of a descending channel for BNB, with key resistance NEAR $808 and support near $710. Price action has recently tested the middle of the channel, bouncing around the $762 mark.
This suggests that the market is currently consolidating, preparing for a possible breakout or further downside. The descending trend indicates the potential for a retest of the lower boundary near $710 before any upward movement can be sustained. As such, the price could dip toward the $700 region, where strong buying pressure may emerge.
Source: X
Volume analysis indicates a significant amount of activity, with a spike in trading volume during earlier price increases. This volume surge was met with a pullback, signaling decreased buying interest and resistance at the $765 mark.
With the current volume remaining around $779 million, the market appears to be in a relatively balanced state, but volatility remains a key factor to watch. If BNB successfully holds above $745, it could potentially attempt to break through the $760 resistance level. However, a failure to maintain these levels could result in further declines toward lower support zones.
Technical Indicators: Mixed Signals in Short-Term Momentum
Technical indicators present a mixed outlook for BNB in the short term. The Percentage Price Oscillator (PPO) has shown a bearish crossover, with the PPO line dipping below the signal line, suggesting a decrease in bullish momentum. The negative histogram further indicates that the recent rally has lost its strength.
Unless the PPO reverses its course and moves back above the signal line, a deeper correction or continued sideways action seems likely. The market’s lack of strong upward momentum aligns with the current retracement, which could lead to further consolidation before a major MOVE occurs.

Source: TradingView
Additionally, the Relative Strength Index (RSI) reading of 52.62 signals a neutral to mildly bullish market, with the index having recently dipped below its moving average. This suggests a decrease in buying pressure, yet the RSI remains above 50, which is typically seen as a neutral sign.
If the RSI holds above this threshold, it could indicate the potential for a renewed upward move. However, if the RSI falls below 50, it could add further weight to a bearish sentiment, reinforcing the possibility of testing lower support levels.
Key Levels and Potential for Reversal
As BNB struggles to gain momentum, the critical support zone between $745 and $750 will play a crucial role in determining its next move. A sustained hold above this level could lead to another attempt to break the $760 resistance, with the $808 resistance being the ultimate target.
However, any significant drop below $745 could expose further downside risks, with $710 serving as the next key support. Traders should closely monitor these levels, as they will provide vital insights into the future direction of BNB.

Source: BraveNewCoin
Ultimately, Binance Coin (BNB) remains in a consolidating phase, with the price action influenced by key technical levels and momentum indicators.
The potential for a dip below $700 remains, but a reversal from these levels could signal a strong recovery. As market conditions continue to evolve, traders should remain vigilant, watching for any signs of breakout or further correction based on these established price points.
