HBAR on the Brink: Fibonacci Support Holds as Breakout Looms

HBAR teeters at a make-or-break moment—bouncing off Fibonacci support like a crypto cat with nine lives. Traders are circling, charts are screaming, and the only thing missing is a Vegas oddsmaker slapping a line on this volatility.
Technical Tug-of-War
The 0.618 Fib level just became HBAR's best friend—for now. Every retest tightens the spring, and this ain't your grandma's consolidation pattern. Watch for volume spikes; they'll confirm whether this is liftoff or another fakeout.
Market Psychology at Play
Retail's split between 'generational buying opportunity' and 'here we go again.' Meanwhile, institutional desks quietly accumulate—because nothing says 'asymmetric bet' like loading up while everyone's distracted by Bitcoin ETF drama.
Closing Thought: If HBAR punches through, the upside could make DeFi degens drool. If not? Well, at least it's not another stablecoin 'peg crisis.'

After a corrective pullback toward key Fibonacci levels, HBAR rebounded sharply, with experts identifying the start of a new impulsive wave structure.
The token recently bounced from the 100% Fibonacci extension near $0.23459 and is now testing a descending trendline around $0.254, positioning it for a potential breakout. Meanwhile, crypto analyst Shawn observed a golden cross on the 1-hour chart, strengthening the short-term bullish outlook.
These technical developments arrive as the HBAR price attempts to reclaim momentum following a period of intraday volatility. If Hedera Price sustains above $0.250, analysts expect a continuation toward $0.28–$0.30, contingent on breaking key resistance.
HBAR Price Nears Breakout Zone After Fibonacci Support Reaction
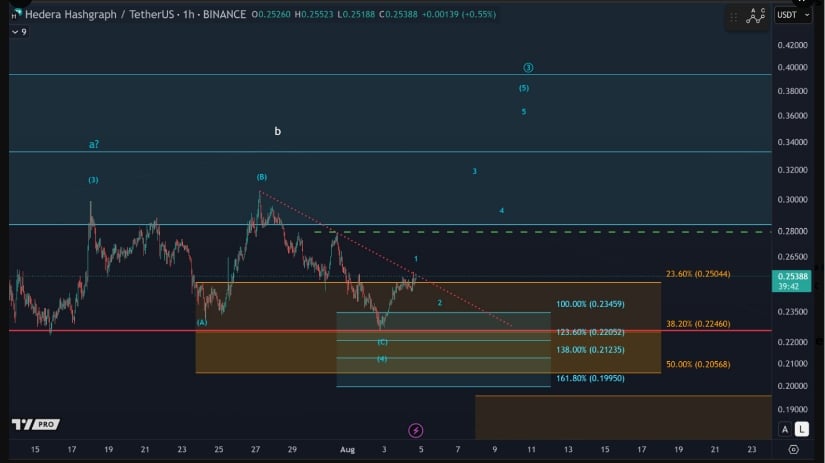
Hedera (HBAR) has recently displayed a corrective structure followed by early signs of a possible bullish reversal. Crypto analyst More Crypto Online shared a wave-based chart analysis suggesting HBAR completed a wave (4) retracement pattern, bouncing from key Fibonacci levels.
Source:X
More so, the altcoin reacted to the 100% extension at $0.23459 and deeper support zones between $0.22460 and $0.22052. This zone served as a potential base for a new upward phase, with the analyst identifying five short-term waves forming from the recent low.
The price structure now shows HBAR approaching a descending trendline resistance, currently located NEAR $0.254. This area coincides with the 23.6% Fibonacci retracement level at $0.25044, making it a short-term threshold for traders.
A confirmed break above this descending trendline could initiate a MOVE toward higher price zones between $0.28 and $0.30, in alignment with the analyst’s Elliott Wave projection. The chart also marks potential further waves that may develop upon a clean breakout from the resistance structure.
Technical Indicators Signal Trend Continuation
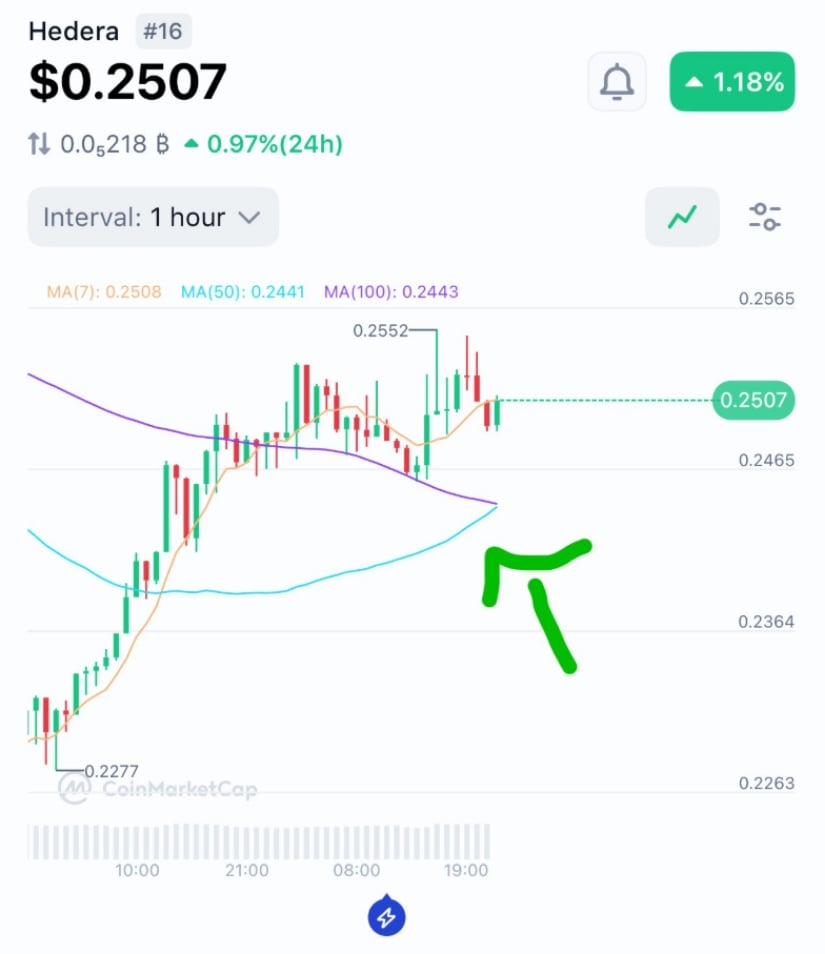
Additional short-term analysis by analyst Shawn shows a golden cross pattern forming on the 1-hour timeframe. The crossover of the 50-period moving average above the 100-period moving average is traditionally seen as a precursor to a trend continuation.
As of the latest chart post, HBAR was trading at $0.2507 with upward momentum supported by moving averages positioned below the current price. The 50-MA and 100-MA sat near $0.2443 and $0.2441, respectively, while the 7-MA aligned at $0.2508, showing a tight confluence around the current price range.
Source :X
During this period, the token reached a local high of $0.2552 before facing rejection, reflecting market hesitation around this zone. However, Hedera price remained above key moving averages, maintaining structural alignment for potential upside continuation. If the current setup persists, a retest of the $0.255 level could lead to more sustained movement.
HBAR Price Volatility Increases Below Key Resistance
Between August 4 and August 5, HBAR experienced intraday fluctuations with prices moving between $0.246 and $0.252. As trading progressed, the token declined toward $0.244, recording a 24-hour loss of 2.62%.

Source: BraveNewCoin
The pullback followed multiple attempts to hold above the $0.250 range, each met with consistent sell pressure. The pattern of lower highs formed during this time suggests that upward momentum may have weakened during the session.
Despite steady volume exceeding $417 million, the price continued to trend lower into the close of the trading window. Sellers appeared active near resistance levels, forcing the token into a downward pattern. If $0.240 fails to hold as support, the Hedera price could revisit previous Fibonacci-based support zones, particularly in the $0.225 to $0.234 range identified in More Crypto Online’s analysis.
HBAR Breakout Structure Awaits Validation
The overall setup across multiple timeframes presents a mixed outlook that requires confirmation. Therefore, analysts see breakout signals from early wave counts, although local resistance and bearish moves show market indecision. The key level to observe remains $0.254–$0.255, where both trendline resistance and session highs have repeatedly pushed the price back.
Should bulls manage to secure a close above this area with increasing volume, short-term targets near $0.280 could become active. Conversely, another rejection could maintain the range-bound conditions that have defined recent sessions.
