🚀 Uniswap (UNI) Primed for $12 Breakout: Bullish Reversal Sparks Rally Hopes

DeFi's favorite liquidity workhorse just kicked into gear—Uniswap's UNI token flashes its first bullish signals since the 2024 market slump.
The Setup:
A textbook reversal pattern completes as UNI bounces off key support. Traders are now eyeing the $12 level—a breakout here could trigger algorithmic buying frenzies and FOMO from sidelined capital.
Why It Matters:
UNI's move coincides with renewed institutional interest in governance tokens (or as Wall Street calls them, 'discounted voting rights with bonus volatility'). The token's 30-day correlation with ETH just hit 0.82—Uniswap remains Ethereum's most critical liquidity layer despite the 'multi-chain future' hype.
The Catch:
Volume remains 40% below Q1 2025 levels. This rally either confirms DeFi's comeback... or becomes another 'false breakout' entry in crypto's hall of shame.

Bulls are attempting to reclaim momentum following weeks of downward drift. As market sentiment improves, UNI’s price trajectory appears to be forming a foundation for another breakout attempt.
Uniswap Price Action Confirms Short-Term Recovery Zone
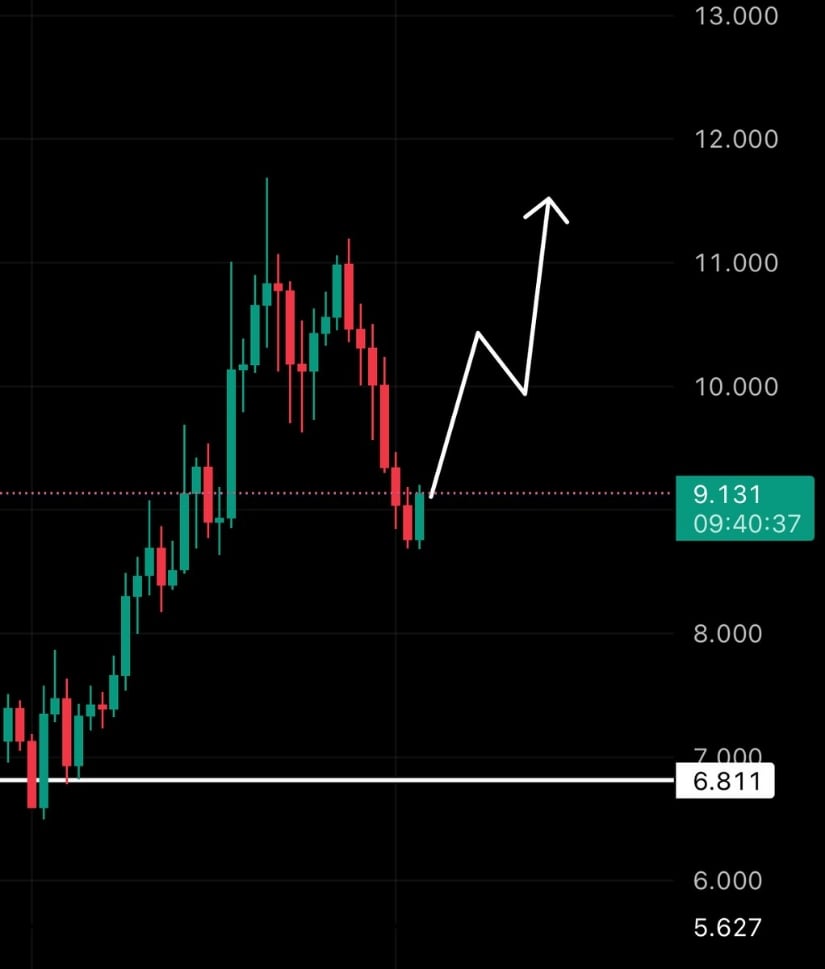
The daily UNI/USDT chart highlighted a rebound effort following a steep correction from July’s peak NEAR $11.686. After dipping toward the $9.13 support region, price action has responded with a bullish candle structure.
Analyst crypto Maniac shared a chart illustrating a potential V-shaped recovery, with a visible trajectory pointing toward a $10 reclaim. The chart also displayed a strong reversal candle after a cluster of red sessions, signaling a rejection of further downside.
Source: X
The visual alignment between higher lows and bullish momentum suggests that UNI is maintaining structural integrity on the broader timeframe. Price has not breached the $8.00 level, which many analysts view as a key invalidation threshold for bulls.
If momentum continues to build and UNI reclaims $10.40, the next resistance band between $11 and $12 could come into focus. Confidence will depend heavily on sustained closes above $9.50 and confirmation through trading volume.
Intraday Chart Highlights Momentum Shift
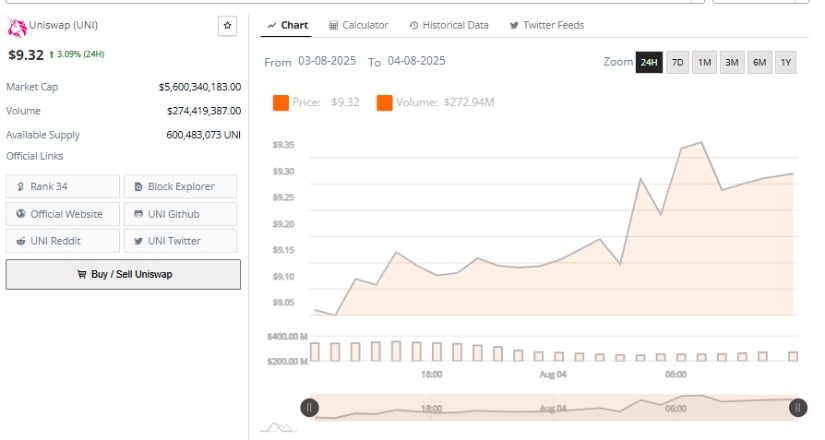
The 24-hour chart covering August 3 to August 4, 2025, showed a progressive climb from around $9.05 to an intraday high above $9.34. This ascent was backed by increasing volume, signaling active participation rather than short-term speculation.
After breaking through the $9.20 resistance level, the token briefly held above $9.30 before stabilizing, suggesting a shift in short-term trend bias.
Source: BraveNewCoin
As of the latest reading, UNI traded at $9.32, reflecting a 3.09% gain over 24 hours. Trading volume exceeded $274 million, with market capitalization reaching approximately $5.6 billion. The surge in trading activity supports the idea of accumulation.
If the price maintains above $9.30, a move toward the $9.75 resistance zone could follow. However, a drop below $9.20 WOULD place the short-term recovery at risk, as it would signal a loss of momentum.
The consistency of volume and steady upward slope during the session adds weight to the bullish argument. Without erratic spikes or sharp pullbacks, the MOVE appears technically sound. The challenge for bulls remains the need for further confirmation through follow-up sessions, especially around the $9.50 zone.
MACD and RSI Suggest Momentum is Rebuilding
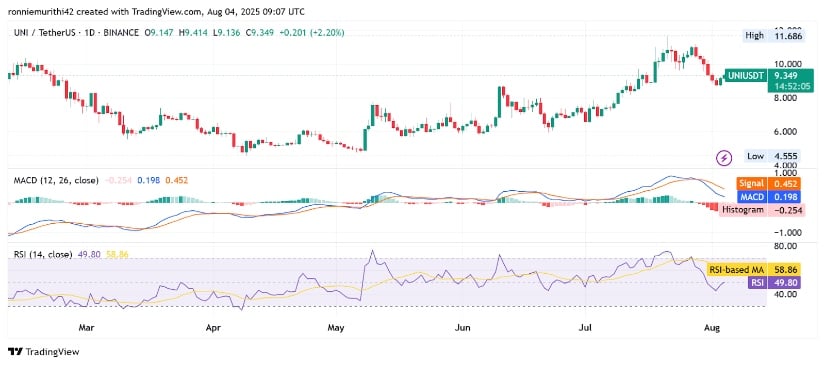
At the time of writing, momentum indicators suggest a cautious but improving setup. The MACD line is positioned at 0.195, trailing the signal line at 0.452, resulting in a negative histogram reading of -0.257.
While both lines are still above the zero line, the slope implies a recent loss of strength. For trend confirmation, the MACD line must cross back above the signal line alongside price strength above $9.50.
Source: TradingView
The RSI currently measures 49.40, hovering just below the neutral 50 level. This reading reflects a balance between buying and selling pressure but shows signs of recent weakening. The RSI-based moving average, still elevated at 58.83, indicates that the asset carried strong momentum in earlier weeks. Reclaiming the 50–55 RSI zone would increase the probability of a sustained move.
Together, these technical indicators reveal that while bullish sentiment is emerging, it remains unconfirmed. The market is watching for stronger signals, including a bullish MACD crossover and breakout beyond short-term resistance. Should these materialize, UNI could realistically challenge the $11–$12 zone identified on both daily and intraday charts.
