Worldcoin Teases Explosive Breakout as Triangle Pattern Tightens—Time to Buy?

Worldcoin's price action is coiling like a spring—and traders are betting it snaps upward.
The cryptocurrency has been etching a textbook symmetrical triangle, a pattern that often precedes violent breakouts. With the formation nearing its apex, volatility could erupt any day.
The Setup:
Lower highs and higher lows have squeezed WLD into an ever-tightening range. Volume’s drying up—classic pre-breakout behavior. When this pattern resolves, moves tend to be fast and furious.
The Stakes:
A breakout above resistance could trigger algorithmic buying and FOMO rallies. But if support cracks? Watch for liquidations cascading through overleveraged perpetual swaps—because nothing fuels crypto downturns like traders getting margin-called.
The Bottom Line:
Worldcoin’s chart is screaming ‘imminent move.’ Whether that’s up or down depends on whether bulls can defend key levels. Either way, grab popcorn—this’ll be entertaining (and probably painful for someone). After all, what’s crypto without a little schadenfreude?

This narrowing formation reflects a buildup in market tension, with momentum indicators offering mixed but critical signals. Chart patterns and volume shifts continue to guide short-term expectations across all major timeframes.
Symmetrical Triangle Setup Builds Breakout Pressure
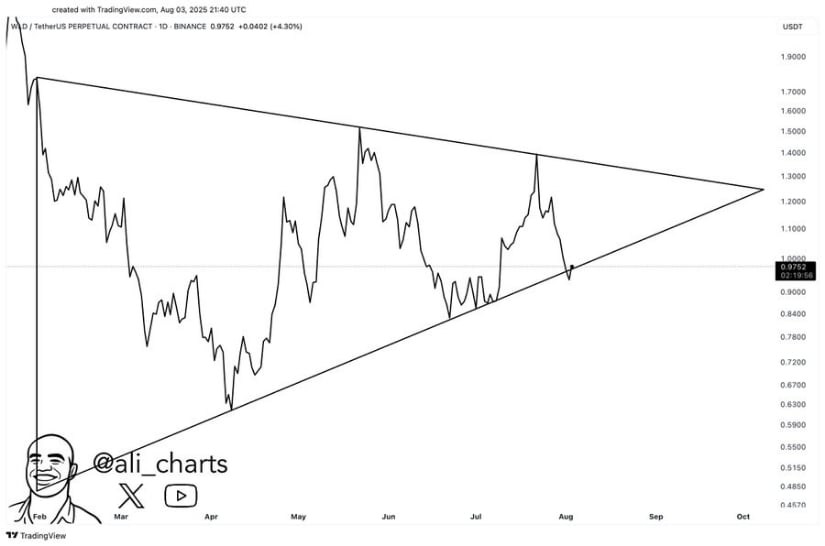
The daily chart shared by analyst Ali shows Worldcoin (WLD) coiling within a symmetrical triangle, dating back to February 2025. This formation is defined by converging trendlines created through a series of lower highs and higher lows, indicating price compression.
Such patterns are known to precede sharp moves as they funnel price action toward a breakout point. The recent price rebound from the ascending trendline NEAR $0.90 confirms that buyers are defending structure, preserving the potential for upward continuation.
Source: X
The current market price near $0.9752 places WLD close to the pattern’s lower boundary but still within the tightening triangle. According to Ali, a successful breakout from this structure could lead to a 60% price movement in either direction.
A bullish breakout above the descending resistance could target levels around $1.50 to $1.60. On the contrary, a breakdown below the ascending trendline WOULD risk triggering a decline toward $0.70 or below. Given the prolonged duration of this setup, the breakout—once initiated—may carry increased strength and velocity.
Accumulation Activity Appears on Lower Timeframes
Short-term price movements between August 3 and August 4 showed steady buying interest leading into a brief breakout. WLD hovered just under $0.97 throughout most of August 3, with minimal volatility.
As volume began increasing near the day’s close, the price slowly climbed, signaling possible accumulation. Early on August 4, WLD breached the $0.97 threshold and briefly spiked above $0.99, reaching a high supported by notable volume surges.
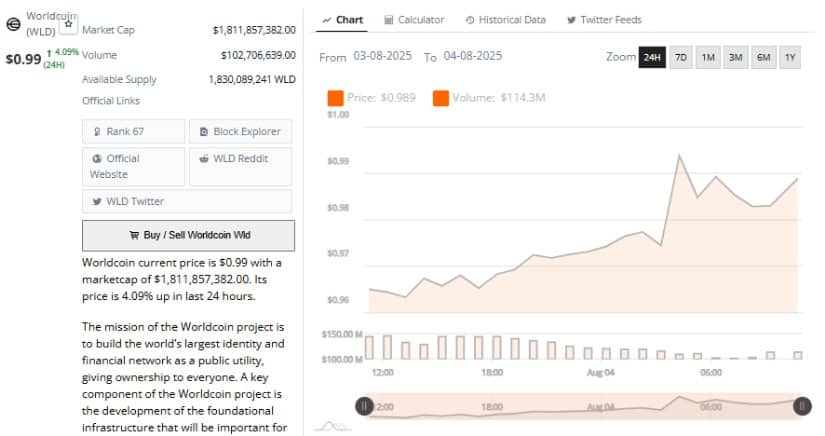
Source: BraveNewCoin
While the spike was short-lived, the price action maintained higher lows following the breakout, suggesting residual buyer support. Volume bars during this period remained consistent, reflecting controlled buying rather than speculative spikes.
These developments may serve as early positioning by traders anticipating a breakout from the broader triangle structure. Short-term resistance sits near $1.02–$1.05, while support around $0.97 remains active. Sustained price action above this level could set the stage for further upside if volume continues to back the move.
Technical Indicators Signal Mixed Sentiment
At the time of writing, WLD trades at approximately $0.985 with a daily gain of 1.03%, while the MACD and RSI offer cautionary signals. The MACD indicator has turned negative, with the MACD line at -0.018 crossing below the signal line at 0.012.
This crossover creates a histogram reading of -0.030, indicating the reappearance of downward momentum. The red histogram bars suggest that buyers have yet to fully reassert control over short-term trends.
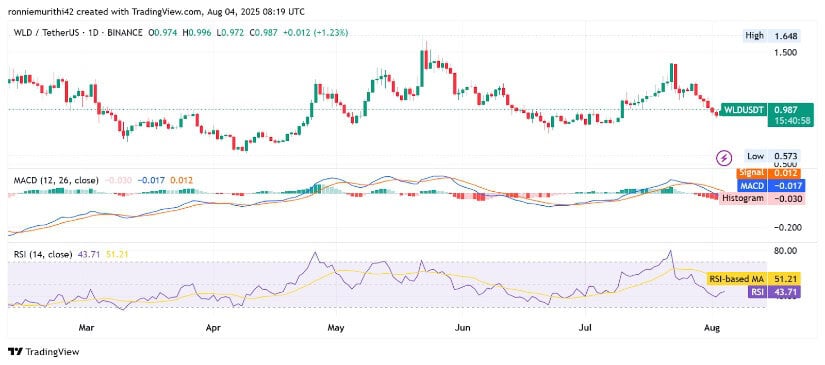
Source: TradingView
Meanwhile, the Relative Strength Index (RSI) sits at 43.53, positioned below its moving average of 51.20. A reading below 50 typically reflects bearish strength, and the recent drop under 45 points to building downside pressure.
However, the RSI remains above oversold thresholds, leaving room for potential stabilization. Traders will be closely monitoring whether the RSI holds or continues to decline. A rise back above 50 could provide early confirmation of bullish re-entry, while further dips may increase the risk of a breakdown.
