Hyperliquid (HYPE) Price Alert: $30 Support at Risk as Fibonacci Meets Liquidity Zones

Hyperliquid's HYPE token teeters on the edge—will $30 support hold or collapse under pressure?
Fibonacci levels and liquidity zones converge, signaling a make-or-break moment for traders. The charts don’t lie, but your portfolio might.
Active traders are eyeing the next move—will HYPE defy gravity or join the graveyard of overhyped assets? One thing’s certain: the market’s patience wears thinner than a DeFi project’s whitepaper.

After peaking just shy of $50, Hyperliquid is now back under pressure, sliding toward the $35 to $30 zone where both technical and heatmap signals are flashing red. Liquidity bands below are lighting up like warning signs, pointing to a likely retest of these levels before any sustainable recovery can begin.
Hyperliquid Heatmap Reveals $35–$30 as Key Liquidity Pockets
Hyperliquid’s new heatmap data from LiquidityHunts reveals intense liquidation interest in the $35 to $30 range. The bright liquidity bands stacked at these levels suggest a magnet-like pull where price might revisit before any real bounce can take place. With the chart already showing lower highs and tight consolidation NEAR these pockets, there’s now a strong probability of a retest towards the $35 zone.
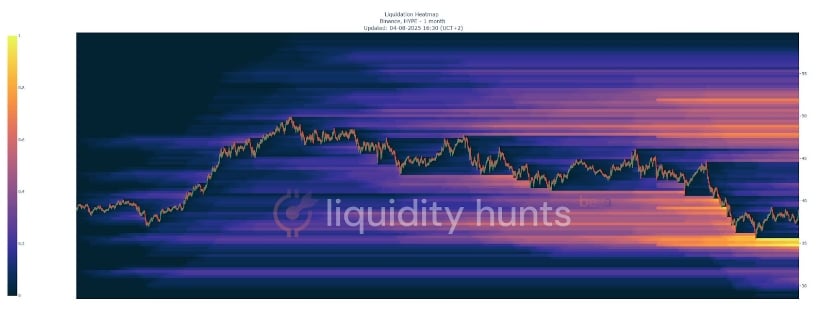
Hyperliquid shows tight consolidation and downside pressure, with $35–$30 emerging as a major liquidity magnet. Source: LiquidityHunts via X
Technically, the structure looks like it’s gradually rolling over, with diminishing volume on each relief MOVE and resistance holding firmly just overhead. If Hyperliquid does tag the $30–$35 region, it could clear out weak longs before attempting a broader reversal.
Hyperliquid Fibonacci Structure Suggests $29–$25 Retest Still in Play
Greeny’s latest Fibonacci chart adds deeper clarity to Hyperliquid’s current retracement structure. Price has already broken below the 0.236 level at $40.40 and is hovering just above the 0.382 retracement at $34.51. This aligns with earlier heatmap data showing heavy liquidity stacked below, reinforcing the possibility that this pullback has more room to go.
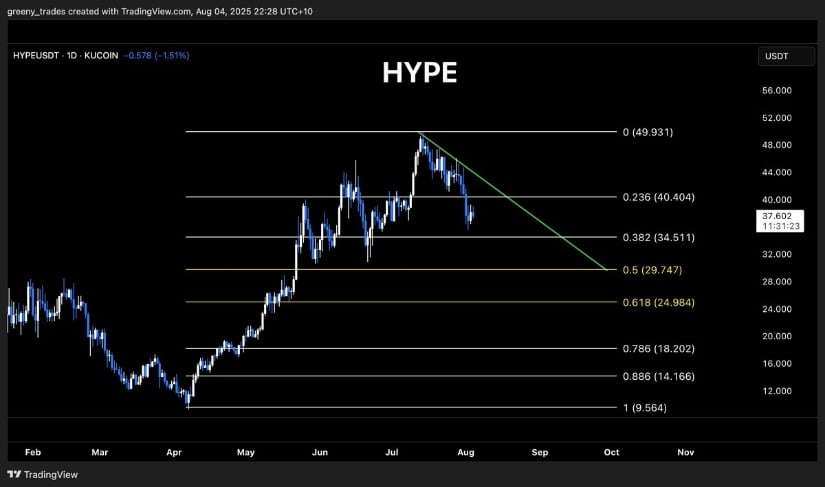
Hyperliquid slips below key Fibonacci levels, with $29.74 to $24.98 emerging as crucial downside targets if selling pressure continues. Source: Greeny via X
The 0.5 and 0.618 Fibonacci zones, $29.74 and $24.98, respectively, now act as prime downside levels if selling persists. These levels often serve as typical corrective targets within a bullish trend, especially after a parabolic run like HYPE just saw.
Hyperliquid Fundamentals Outpace Price Action
Despite the recent cooling in price action, Hyperliquid’s fundamentals, especially its deflationary mechanism, are still standing strong and firm. As JoJo highlights, over $538 million has been spent on buybacks in just 238 days, an eye-popping 97% of all fees generated since late 2024. Instead of pocketing profits, the team has committed every dollar toward supporting HYPE. It’s rare to see this kind of alignment between protocol revenue and token support, especially at this scale.
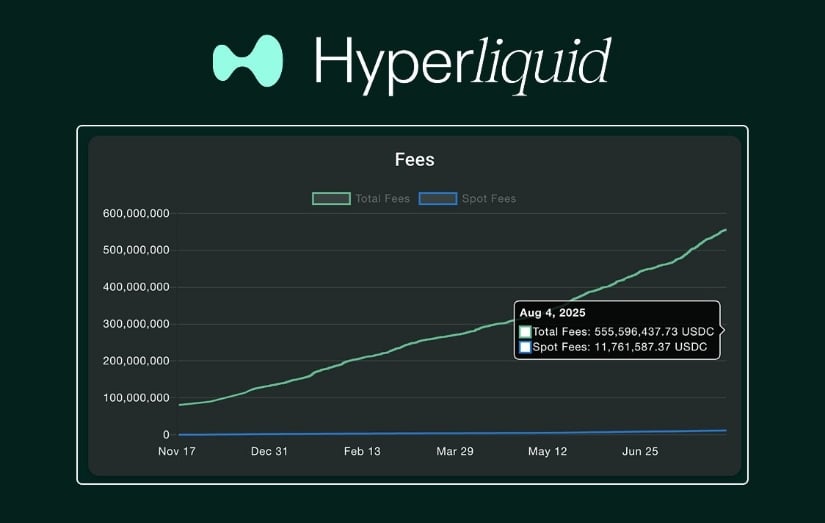
Hyperliquid has spent 97% of its fees, over $538M, on buybacks. Source: JoJo via X
This makes the ongoing price retrace even more puzzling. As noted in earlier technicals, HYPE is approaching deeper support zones around $30, with signs of liquidation clustering and corrective targets stacking up. Yet fundamentally, this level of aggressive buyback activity WOULD typically act as a floor.
Contrary View: Harmonic Structure Supports Rebound Over Breakdown
While recent sections pointed to DEEP liquidity traps and key retracement targets for Hyperliquid, this new ABCD harmonic pattern presents a potential reversal angle. The formation outlined by hyperliquidnow suggests a textbook bearish harmonic structure, ironically one that often triggers a bullish reaction first before any downside resolution. With the AB=CD leg extending towards the $55 to $60 zone, the current bounce from the 100MA and point C may still have room to run in the short term.
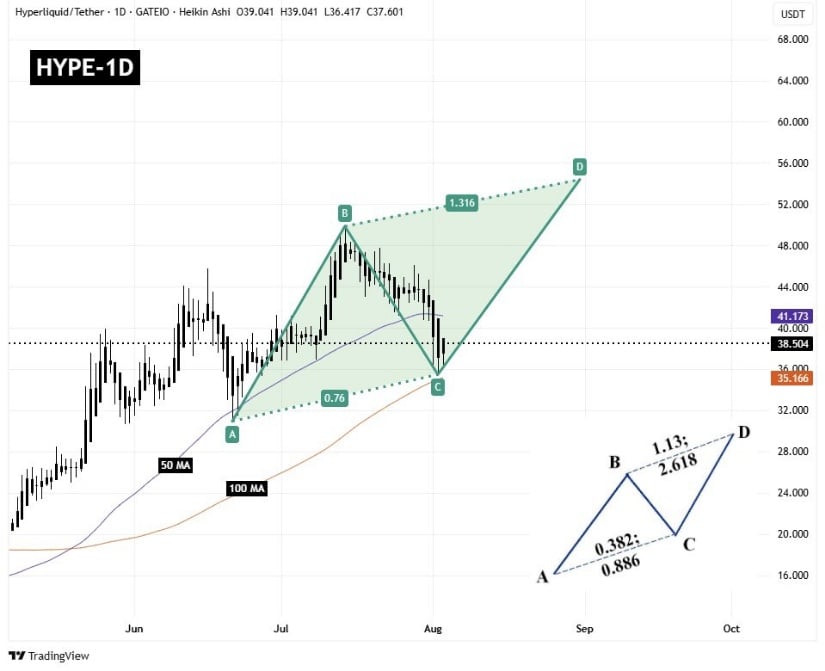
A new ABCD harmonic pattern hints at a possible short-term rebound for Hyperliquid. Source: hyperliquidnow via X
From a technical standpoint, this setup adds nuance to the broader bearish sentiment. The pattern’s symmetry and ideal ratios, particularly the 0.786 retrace to C and projected 1.27 to 1.618 extension to D, offer a clean structure. While the macro trend still leans corrective, this ABCD projection could spark a near-term rally before broader resistance resumes control.
Hyperliquid Technical Analysis
The 4H structure from Justpit lays out a clear two-scenario framework for Hyperliquid. On the bullish side, a break above $40 followed by a successful retest could act as a launchpad toward the $44 to $46 resistance range. This potential continuation aligns with the earlier harmonic pattern projection, suggesting bulls still have a say.
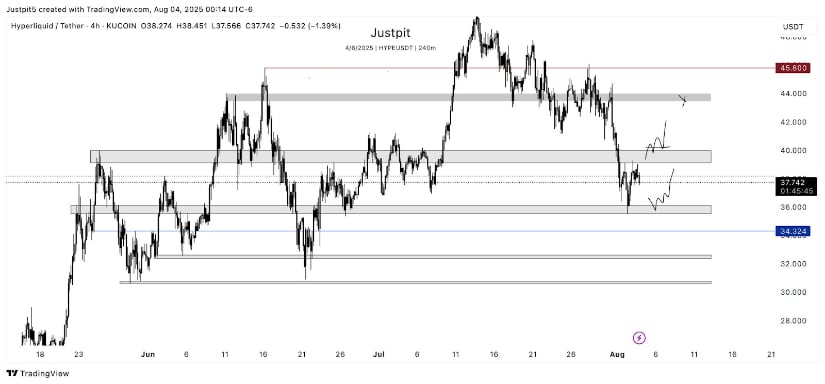
Hyperliquid’s 4H chart shows a breakout above $40 could target $44 to $46, while losing $36 may trigger a drop towards $34.32. Source: Justpit via X
On the flip side, failure to hold $36 could expose Hyperliquid to another leg lower, with the $34.32 zone highlighted as the next area of interest. This level coincides with the upper band of earlier heatmap support and sits just above the 0.382 Fibonacci retracement.
Final Thoughts
Hyperliquid’s technicals and liquidity maps are signaling pressure, with the $30 to $35 zone becoming the next possible area of interest. The break below key Fib levels and persistent lower highs reflect a market still in correction mode. This pullback is unfolding while fundamentals remain incredibly strong, with nearly all protocol fees being redirected into buybacks. That kind of alignment is rare, and it creates a case where price may be lagging behind reality.
It all comes down to whether Hyperliquid’s fundamentals start to outweigh its current technical fragility. If bulls can reclaim $40 and flip it into support, a fast push towards $44 to $46 isn’t off the table.
