Dogwifhat (WIF) Price Prediction: Bullish Breakout Looms as $1 Support Holds Strong

WIF defies gravity—memecoin claws back critical $1 level as traders eye next leg up.
The $1 Floor Holds
Dogwifhat’s rebound from key support signals potential bullish momentum. No fancy TA needed—when a coin bounces hard off a psychological level, even Wall Street ‘experts’ pay attention (between martini lunches).
Breakout Watch Activated
All eyes on WIF’s chart structure. A sustained hold above $1 could trigger FOMO—and you know what comes after that. Just don’t blame us when your ‘measured move’ target gets wrecked by a whale dump.
The Memecoin Paradox
Yes, it’s a dog with a hat. No, fundamentals don’t matter—until they suddenly do. Welcome to crypto’s irrational theater, where technicals trump logic until the music stops.

The MOVE comes after a steady recovery from intraday lows and a brief period of consolidation, positioning the asset for potential upside.
A broader wave pattern indicates WIF may have completed its corrective phase, with technical setups pointing to a turning point. At the time of writing, momentum indicators remain neutral, but price stability above $1.00 could set the tone for the next directional move.
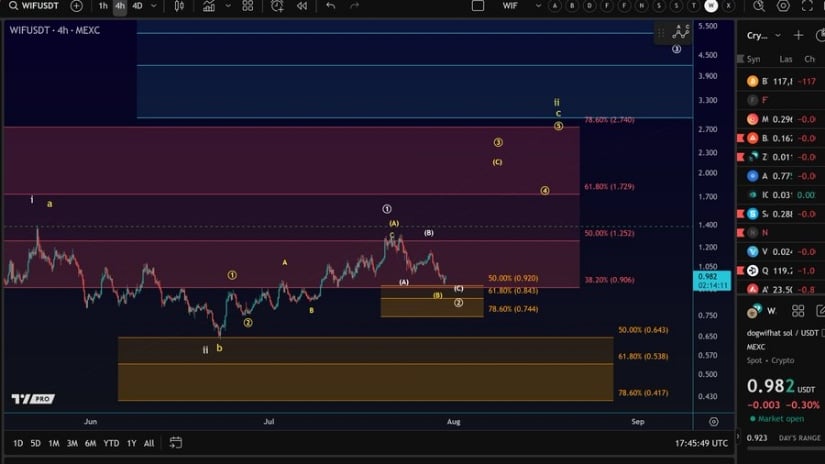
Elliott Wave Suggests Completion of ABC Correction
The 4-hour chart shared by analyst @Morecryptoonl reveals a classic three-wave ABC correction unfolding from the July peak at $1.73. WIF has retraced to the 50% Fibonacci level at $0.92, forming a potential bottom for the C-leg of the correction.
This support zone also aligns with historical price reactions and subwave formations, suggesting that the current range could serve as a local floor. The structure fits within a broader impulsive Elliott Wave cycle, and if wave C has concluded, a new upward impulse may follow.
Source: X
The confluence of technical factors between $0.92 and $0.74, including the 50% to 78.6% Fibonacci levels, increases the significance of this zone. Traders are monitoring the price reaction closely as a rebound could trigger the start of wave III within the broader bullish structure.
Key resistances in this scenario lie at $1.25 and $1.73. A breakout above these levels WOULD validate the wave count and open targets near $2.74 and $3.94, according to the Fibonacci extension levels mapped in the chart. Until then, price confirmation remains necessary to establish trend direction.
Short-Term Price Action Holds Above Key Support
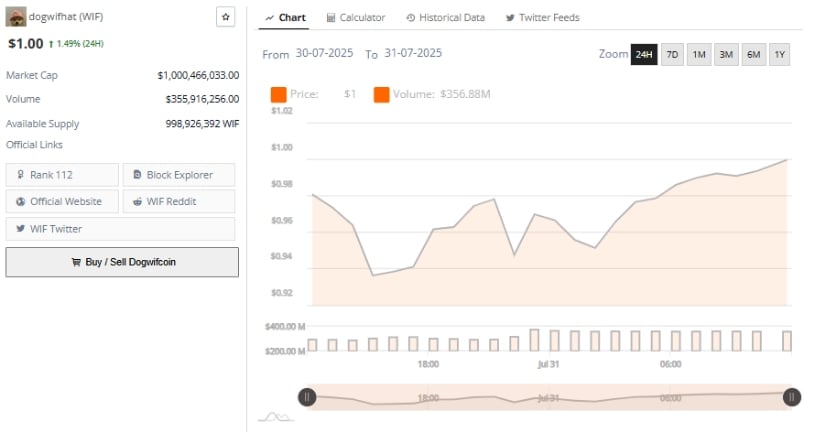
The 24-hour price movement from July 30 to July 31 indicates a steady recovery from a session low of $0.92 to a close NEAR $1.00. This movement was marked by the formation of higher lows and higher highs, a classic indicator of sustained buying activity.
The asset reclaimed $0.96 early in the session and continued to climb gradually toward the psychological resistance level of $1.00. The lack of extreme volatility throughout the session suggests that the buying interest may be more consistent than speculative.
Source: BraveNewCoin
Volume data supports the technical recovery. Total daily trading volume reached approximately $356.88 million, reflecting healthy market participation. The steady price rise, accompanied by consistent volume, indicates that the move may be driven by genuine accumulation.
This volume behavior, combined with the recent price structure, implies that traders are positioning around the $1.00 level, either for breakout continuation or a potential retest of lower support. A successful hold above $0.96 could reinforce near-term bullish sentiment, while a drop below that level may expose downside toward $0.85.
At the Time of Writing: Indicators Signal Market Equilibrium
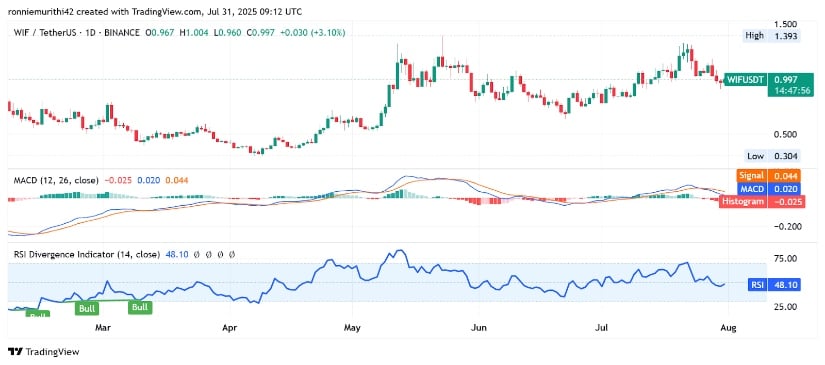
As of the latest daily candle, WIF trades at $1.001, up 3.52% on the day. The daily candlestick structure shows signs of renewed interest around the $0.96 support zone. However, momentum indicators remain cautious.
The MACD line currently stands at 0.020, below the signal line at 0.044, with a histogram reading of -0.024. This configuration reflects a bearish crossover, implying that upward momentum has yet to reassert itself decisively. Unless the MACD turns upward and crosses the signal line, the rally may struggle to sustain.
Source: TradingView
The RSI is currently at 48.38, hovering near the neutral midpoint of 50. This level suggests a balanced struggle between buyers and sellers, without a clear directional signal. The RSI has remained range-bound for weeks, failing to break above 60 or fall below 40, highlighting the lack of a strong trend.
A push above 50 would help confirm bullish strength, while a slip below 45 could shift sentiment toward bearish continuation. For WIF to sustain its breakout attempt, both MACD and RSI will need to turn in favor of buyers in the coming sessions.

Log in to Reply
Log in to comment your thoughtsComments
Related Articles
|Square
Get the BTCC app to start your crypto journey
Get started today Scan to join our 100M+ users